
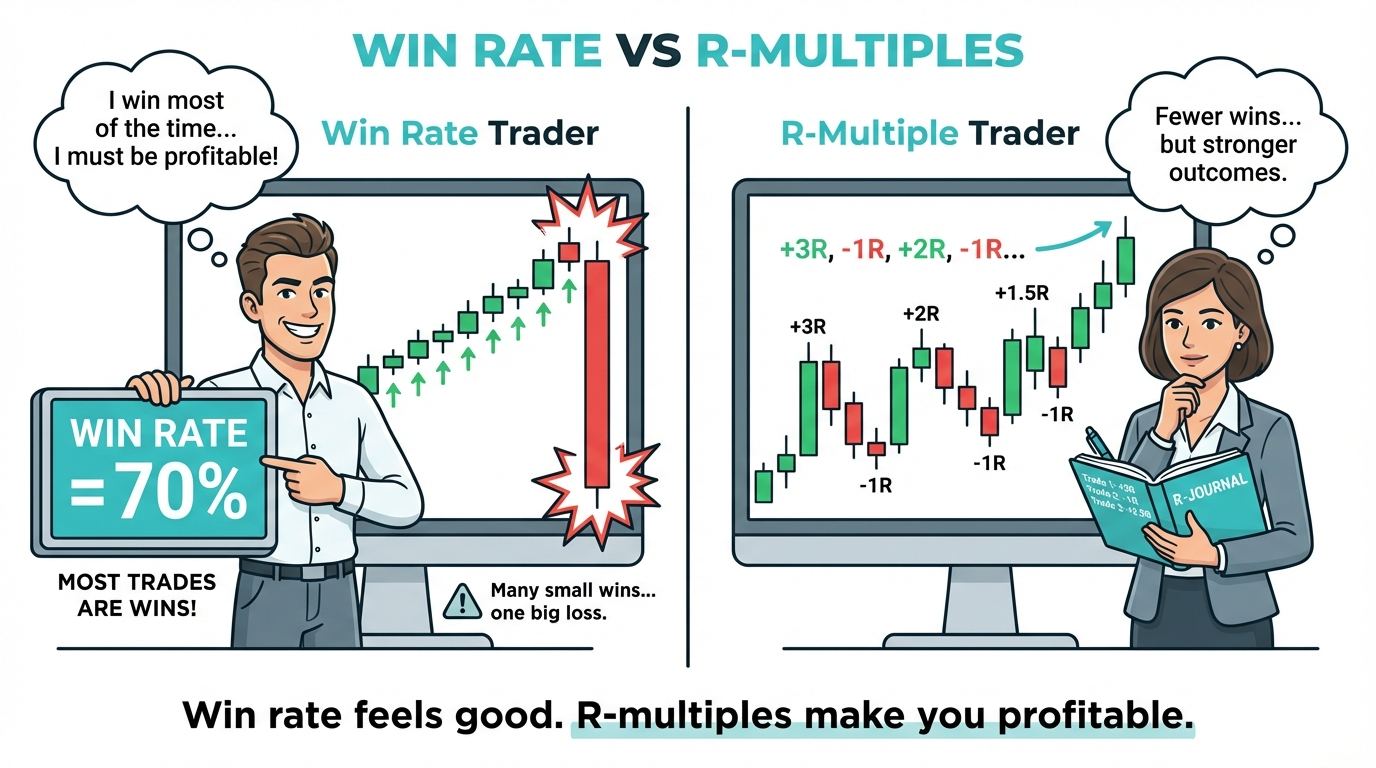
Many traders focus on win rate, assuming more winning trades automatically mean profitability. Without considering R-multiples, win rate alone provides an incomplete view of trading performance.
Win rate alone, however, cannot determine whether the strategy is profitable or not.
It is possible for a trader to have a lot of wins but suffer from loss because his losing trades are greater than his winning trades on the average.
Alternatively, there may be lesser winning trades that can still generate positive expectancy because its winning average outweighs the losses on the average.
The r-multiples measure can give the trader a means of comparing the outcomes of his trades against his predetermined risk levels.
This takes the concept straight from Risk Per Trade Explained, where setting a fixed risk amount is key to objectively gauging results. Win rate measures frequency. R-multiples measure impact.
In this article, we explain how win rate, R-multiples and trading expectancy work together, and why all three matter when evaluating trading performance.
What Does Win Rate Actually Tell Us?
Win Rate refers to the percentage of winning trades made by completed trades. Suppose a trader makes 60 winning trades from a total of 100 trades, the win rate would be 60%.
But Win Rate does not say anything about the profitability of each trade. A high win rate system might end up making a loss if the average loss exceeds average gain. A low win rate strategy may also make a profit if the average wins exceed average losses.
The Hidden Problem With High Win Rates
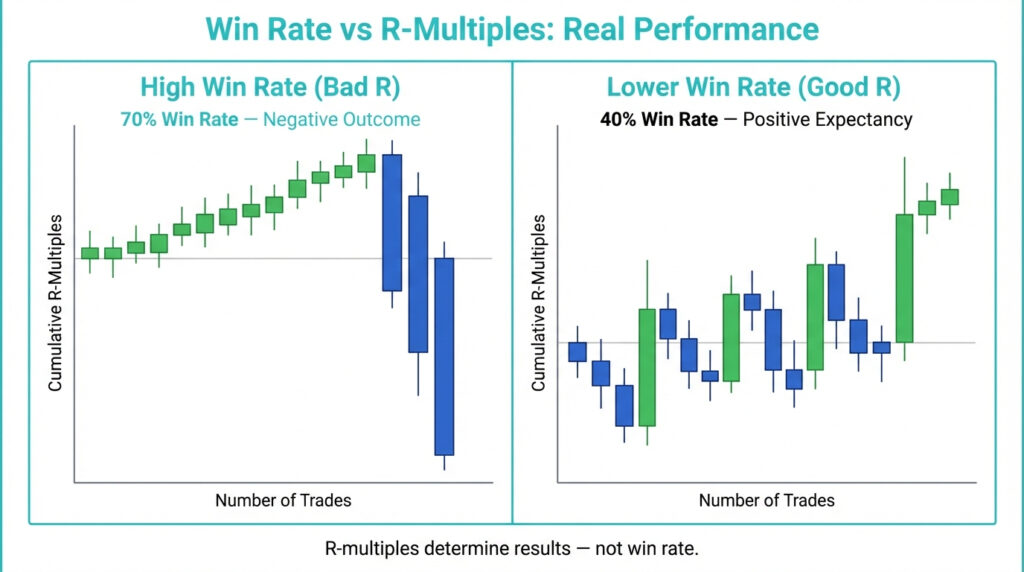
A high win ratio can give a false picture of the success of trading if the magnitude of losses is not considered. There are some strategies that generate many small wins but also some large losses. A number of winning trades can be cancelled out by one big loss.
This could happen in a case where the trader increases exposure or holds the losing trade open without considering the adverse movement of the market. Stop loss orders might help in setting an ideal level of exit, but they do not ensure a certain exit price.
The article Take Profit & Stop Loss Explained explains how to keep your cash safe and prevent things from going haywire.
When you don't manage your losses, winning feels good, but it hides part of the story.
What Are R-Multiples?
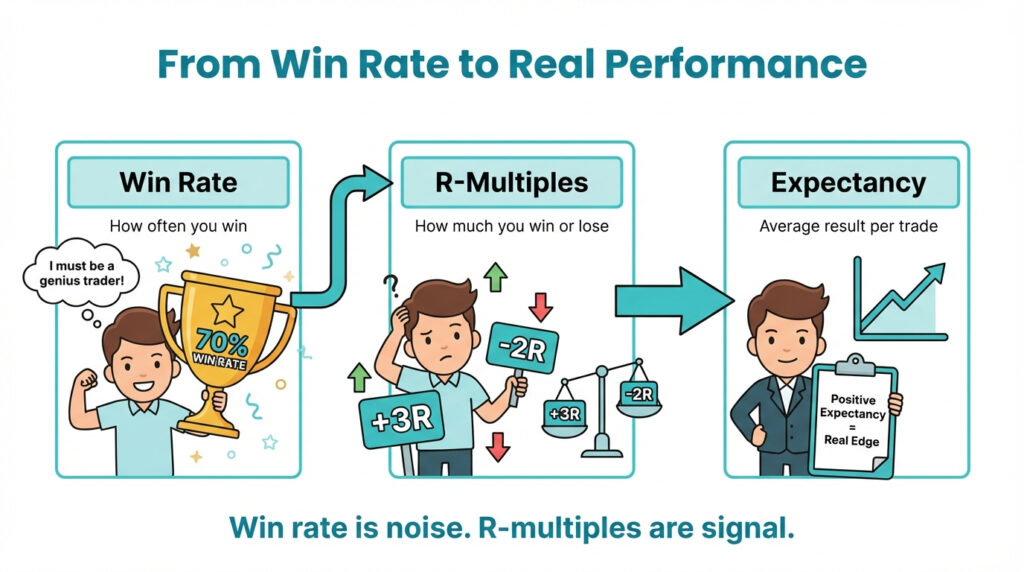
An R-multiple measures the outcome of a trade relative to its predefined initial risk.
Defining R in Trading
The letter R represents the amount initially planned to be at risk on a trade.
For example, suppose a trader establishes an initial risk of $100.
- A $200 profit represents +2R.
- A $100 loss represents −1R.
- A $50 loss represents −0.5R.
- A $300 loss represents −3R.
The use of R-multiples enables one to make comparisons between trading operations conducted with varying amounts of risk and trade positions.
Nevertheless, the definition of the initial risk must be consistent since the real loss may surpass the initial risk due to slippages, market gaps, or any other conditions during the execution of the trade.
Moreover, transaction expenses should also be taken into account.
Why R-Multiples Matter Alongside Win Rate
Win rate and R-multiples represent two different measures of trading results. Win rate tells how often trades yield positive results.
The R-multiplies show the size of these results compared to the initial risk. Both measurements play an essential role in trading analysis.
For instance, a person who has a smaller win rate will still have positive expectancy as long as their average winning trade is large enough compared to their losing trades.
At the same time, bigger individual winnings do not mean that one can be profitable. Winning/losing frequencies, transaction costs, and changes in the market also need to be taken into account. More details on this connection can be found in Reward-to-Risk Ratio and Trading Expectancy.
This idea ties into the Reward to Risk Ratio & Trade Expectancy, which is about making money over time by balancing good and bad outcomes, not just how often you win.
Profitability depends on the size of the outcome, not the number of outcomes.
Win Rate vs R-Multiples: Practical Comparison
Two trading strategies can have very different win rates and still produce different expected outcomes.
Trader A: High Win Rate, Negative Expectancy
Let us examine a hypothetical trader who wins at a rate of 80%.
On average, he makes +0.25R on each winning trade and −2R on each losing trade.
Even though he wins in most cases, the expectancy is negative at −0.20R per trade before costs.
It demonstrates that large losses could compensate for small wins even if they happen quite often.
Trader B: Lower Win Rate, Positive Expectancy
Now consider a hypothetical trader with a 40% win rate.
The average winning trade generates +2R, while the average losing trade produces −1R.
This produces an expectancy of +0.20R per trade before costs.
Although Trader B wins less frequently, the relationship between average gains and losses produces a more favourable expected outcome.
However, positive expectancy does not guarantee profits over any particular period. Actual results may differ because of market conditions, execution costs and the variability of trade outcomes.
This method follows the complete planning guide outlined in Trade Lifecycle Explained: From Idea to Exit, where we lay out risks, entry points, and exit points before we act. Consistency emerges from structure, not win frequency.
R-Multiples and Trade Expectancy
Trading expectancy describes the average expected outcome per trade based on the probability and size of winning and losing results.
How R-Multiples Help Measure Expectancy
The concept of R-multiples makes it possible to express expectancy in relation to the risk set for each individual trade.
For instance, the expectancy of a trading system can be +0.20R per trade, according to calculations based on the win probability and the average values of winning and losing R-multiples.
On the other hand, expectancy can be measured in dollars or in percentage gains.
It is not mandatory to use R-multiples when calculating expectancy; they simply help in comparing different trades.
Historical expectancy is a prediction based on past performance of the system. This does not mean that the future trades will have the same outcome.
Market changes, trading costs, and sample size are some of the factors that may influence the accuracy of the estimation.
Why Beginners May Focus Too Much on Win Rate
A win in trading can be considered to bring about progress, especially for beginners who are yet to understand how to measure their trading success.
Nevertheless, concentration only on the ratio of winning trades may make the trader ignore the magnitude of the loss and the exposure of every trade to loss.
Traders may sometimes end a winning trade too early just so they can register a win or hold onto a losing trade hoping that it turns around.
This may influence the relation between average profit and loss.
This emotional reaction fits into wider mental habits discussed in Trading Psychology Explained, where the need for quick wins trumps sticking to a long-term plan. The market rewards consistency, not emotional comfort.
How to Start Using R-Multiples in Practice
R-multiples can help traders organise and review trade outcomes using a consistent measurement framework.
A Practical Approach to Recording Results
Before opening a position, determine the amount of money that will be put at risk.
This value is what constitutes the reference of 1R. Once the position is closed, the gain or loss should be divided by the initial value of money at risk to find the actual R-value.
Consistent recording of data may enable traders to evaluate the average winning R-value, losing R-value, win percentage, and historical expectation.
These metrics can be used for performance evaluation, but they cannot predict the future. This method aligns well with the risk control strategies we learned in Risk Per Trade Explained.
You can safely practice measuring trade outcomes in a demo environment using VARIANSE trading account and strengthen your structured learning with their VARIANSE Academy education page.
Measurement creates clarity.
This drives home the point that we have to look at how well someone's doing relative to the risks they're taking, not just how often they win.
Conclusion: Win Rate vs R-Multiples — Key Takeaways
Although win rate is a good indicator that helps traders to understand how often their trading strategy wins, it doesn't prove whether the strategy itself is profitable.
R-multiples give additional insight because they allow for assessing each trade in relation to initial risks.
In combination with average profits, average losses and trading expectancy, they help to get a more detailed understanding of trading results.
Still, even positive trading expectancy doesn't mean future profitability because of other factors like market conditions and trading risks.
So for those who are just starting to trade, the main message to take away from the above discussion is the necessity to consider both frequency and size of trading results.