
Trading indicators can make financial charts easier to understand. But can they actually tell you where prices will move next?
Not reliably.
Understanding why indicators don’t predict price matters for anyone learning technical analysis. Indicator tools such as moving averages, the Relative Strength Index (RSI), and MACD use available market information to highlight trends, momentum, volatility, and shifts in market states.
Nevertheless, the identification of a market condition is different from forecasting what will happen next.
Indicators may aid traders in understanding the movement of prices, but they certainly cannot predict the future. This difference should be understood by beginners in order to avoid one of the most typical mistakes made by novice traders.
What Are Trading Indicators?
Trading indicators are mathematical calculations that convert raw market data into usable information, helping traders analyze charts effectively.
Depending on the indicator, calculations may incorporate:
- Opening, closing, high and low prices
- Recent price changes
- Historical price ranges
- Trading volume, where available
- Statistical measures derived from market data
Different indicators are developed to explain various characteristics of market behavior.
For instance, moving averages filter price data across a specific number of periods so that it becomes easier to see the general trend.
The RSI shows the degree of price changes during a certain period and helps to understand the dynamics of the market. Bollinger bands use a moving average and the level of standard deviation to demonstrate how price changes around its average over time.
They are all examples of technical analysis but cannot give any independent insight on the future of prices.
Why Don't Trading Indicators Predict Price?
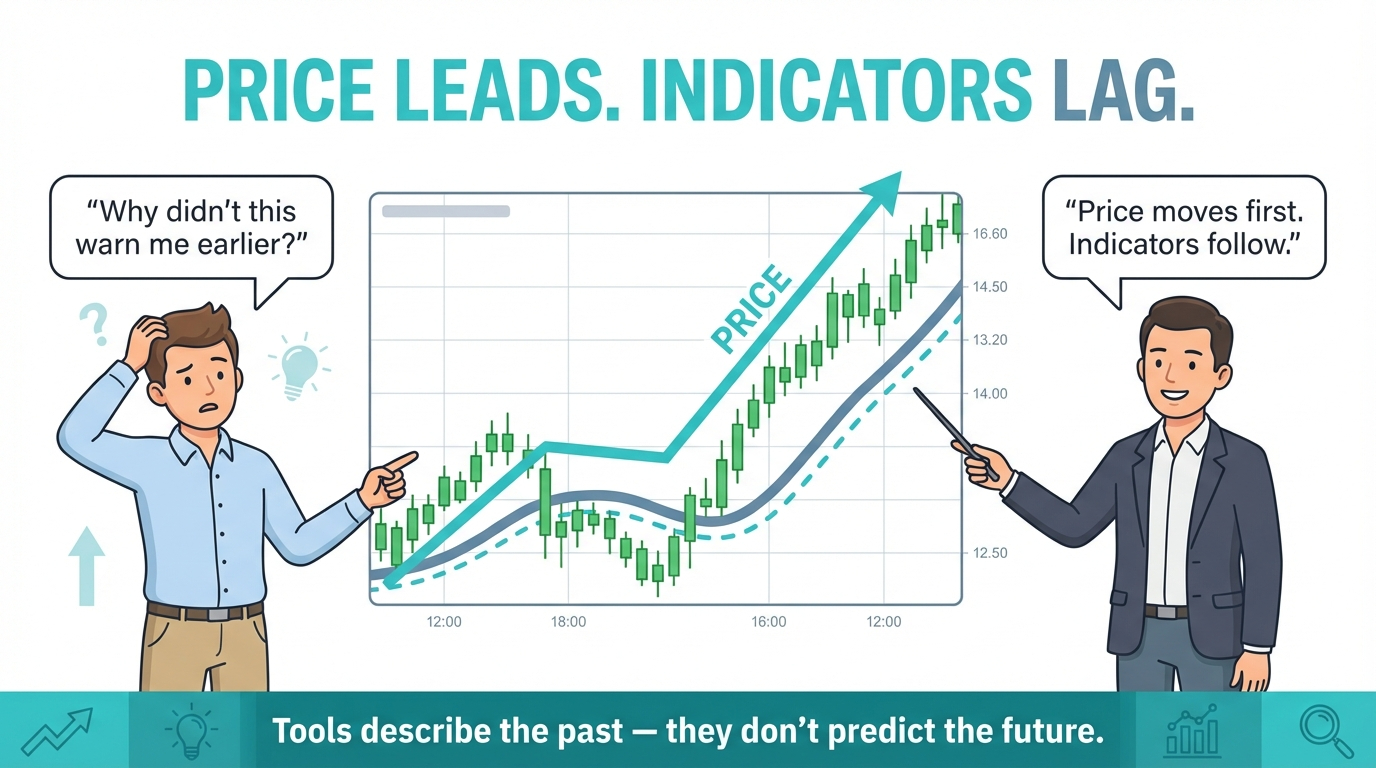
The basic problem with technical indicators is that they are based on information that is already known to the market.
Consider an example of a 50-period simple moving average.
The indicator’s value is computed based on the prices for the last 50 periods. The computation changes as new price information becomes available.
The moving average may be used to analyze the behavior of prices in these periods, but not to predict how the next period will look like.
It does not imply that indicators are totally useless in prediction. Traders might use them to form expectations or prove their trading theories. Still, the forecast will always be uncertain since future market situation may differ from the past one.
Prices may be influenced by:
- Economic announcements and interest-rate decisions
- Changes in liquidity
- Market expectations and sentiment
- Political and geopolitical developments
- Unexpected news
- Trading activity and changing supply-and-demand conditions
An indicator cannot know in advance how these factors will interact or how prices will respond.
Why Do Trading Indicators Lag?
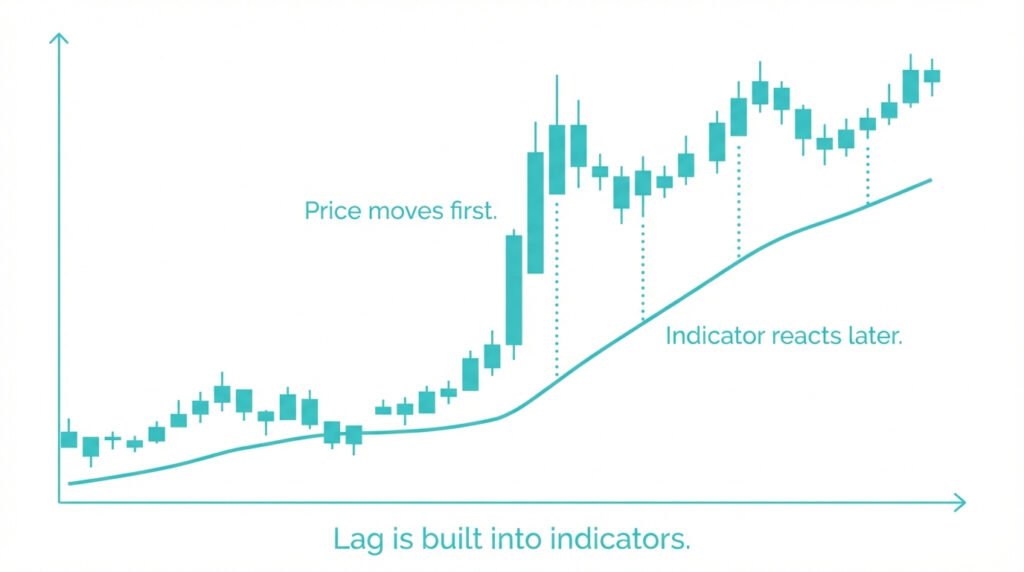
Imagine EUR/USD rises from 1.1000 to 1.1100 over several trading periods.
A 50-period moving average will not immediately move from 1.1000 to 1.1100.
And that is because the formula for calculating the moving average takes into account past prices.
Since new prices become part of the calculation process and old prices are being excluded from it, this is done in a gradual manner.
By the time a clear upward trend has developed on the chart for the moving average, part of the change in prices might have occurred.
Why Indicator Settings Matter
The amount of periods for the indicator can affect its speediness of response to price changes.
The shorter period moving average will be more sensitive than the longer period one and, vice versa, will look more choppy.
Though increased sensitivity may lead to a higher frequency of indicator responses to fluctuations.
Here we have the contradiction of speed versus smoothness. Neither of those two approaches removes the problem of volatility.
Another thing worth mentioning is that some indicators keep updating constantly during the formation of a candle, and their values may vary before its close.
Leading vs Lagging Indicators: What's the Difference?
Not every technical indicator is classified as lagging. Understanding these classifications helps beginners recognise what different indicators are designed to measure.
Leading Indicators
The indicators are referred to as leading indicators because they are used by traders to find out situations that might be preceding any price movement.
The following indicators are referred to as leading as they help traders determine factors that could signal a possible future change in the trend.
They include:
- Relative Strength Index (RSI)
- Stochastic Oscillator
However, the term leading can be misleading.
Leading indicators do not forecast the future. Rather, they help identify situations that traders could link to future changes in the price trend.
For instance, RSI could reach the value which is said to be overbought.
That means there is considerable upward momentum of the price trend according to the indicator’s calculation method. That does not mean the prices have to fall. The market could stay overbought while prices are still increasing.
Lagging Indicators
Lagging indicators are generally used to describe or confirm movements that have already developed.
Examples include:
- Simple moving averages
- Exponential moving averages
- MACD, which uses relationships between moving averages
These indicators may help traders identify existing trends or changes in momentum. However, they can respond after a substantial part of a movement has already occurred.
Does Leading Mean Better?
Not necessarily.
Leading indicators may produce earlier signals, but those signals can be misleading. Lagging indicators may provide smoother information, but they can respond more slowly to changing market conditions.
The distinction is not that one category predicts prices and the other does not. Both process market information differently and have limitations.
Why Indicators Can Look Predictive on Historical Charts
Charts based on history could cause indicator signals to appear to be more accurate than what would have been perceived during real-time trading.
Think about looking at a completed price chart.
You see RSI hitting an extreme right before a reversal occurs. Also, there is a moving average cross at the start of a trend.
Looking backwards, these signals may seem obvious.
However, there is an important problem: you already know what happened next.
Indicators vs Price Action
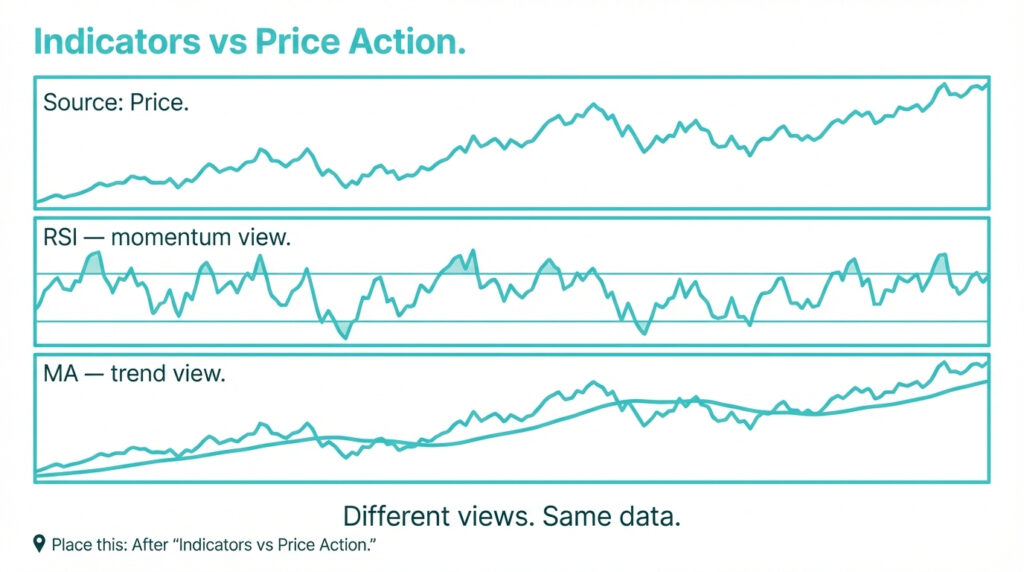
Price action analysis focuses on the behaviour of prices themselves rather than relying primarily on mathematical indicators.
Traders examining price action may study:
- Market trends
- Previous highs and lows
- Support and resistance
- Trading ranges
- Breakouts and pullbacks
- Candlestick structures
- Broader market conditions
Many technical indicators use price as a primary input, although some also incorporate information such as volume.
Indicators transform this information into another format.
A moving average can make the broader trend easier to observe. RSI can make momentum changes easier to compare. Bollinger Bands can provide additional context about volatility.
Indicators and price action therefore do not necessarily need to compete.
For example, a trader studying a potential support or resistance area might use an indicator to assess momentum as price approaches that zone.
The indicator provides additional context rather than deciding whether the level will hold.
Why More Indicators Don’t Mean Better Signals
A common beginner mistake is adding more indicators in hopes of stronger confirmation.
A chart might include RSI, MACD, Stochastic Oscillator, Bollinger Bands, and several moving averages at once.
Instead of improving analysis, this can produce:
- Conflicting signals
- Duplicate information
- Excessive confirmation
- Delayed decisions
- Unnecessary complexity
Several indicators may also measure similar characteristics.
For example, using multiple momentum indicators does not necessarily provide several independent confirmations. They may simply be interpreting similar underlying price behavior using different formulas.
A more useful question is:
What does each indicator add to the analysis?
If two or three indicators provide essentially the same information, adding all of them may offer little additional value.
What Are Trading Indicators Actually Useful For?
Although indicators cannot reliably predict prices, they can still serve useful analytical purposes.
Their value depends on understanding what they measure and how their limitations affect interpretation.
Identifying Trends
Moving averages and other trend-following indicators can help traders examine the general direction of historical price movements.
For example, a moving average that slopes upwards may indicate that prices have generally increased over its calculation period.
However, this does not guarantee that the upward movement will continue.
Market conditions can also change between trending and ranging behaviour.
Learn more in Trend vs Range Markets.
Measuring Momentum
Momentum indicators like RSI explain the strength or speed of recent price changes based on their computations.
They offer information regarding recent market activity.
But high momentum does not necessarily mean that momentum will continue, while low momentum does not necessarily indicate a change.
Understanding Volatility
Volatility indicators help traders examine how much prices have fluctuated.
Two common examples are:
Average True Range (ATR): Measures recent price-range volatility, including gaps between periods where relevant.
Bollinger Bands: Use standard deviation around a moving average to describe how widely prices have varied relative to that average.
These tools provide different perspectives on volatility.
However, neither can determine the size or direction of the next price movement with certainty.
Providing Confirmation and Context
Indicators can be used to supplement chart analysis to structure the market data in an organized manner.
For instance, a trader may analyze price action in conjunction with a momentum indicator to see how each of the aspects of recent market action is performing.
This indicator adds perspective without actually making a determination whether or not to enter into the trade.
Common Indicator Mistakes Beginners Make
Beginners often encounter problems when they expect indicators to provide more certainty than their calculations can support. Recognising these mistakes is an important part of developing technical analysis skills.
Common mistakes include:
- Treating indicator signals as guarantees
- Using too many indicators at once
- Following signals without understanding the calculation
- Ignoring broader market conditions
- Constantly changing settings after losing trades
- Combining several indicators that measure similar things
- Assuming historical performance will continue
- Ignoring risk because an indicator signal appears strong
Another common mistake is searching for a “perfect” combination of indicators.
No combination removes uncertainty from financial markets.
Understanding a tool's limitations is therefore as important as knowing how to use it.
How Should Beginners Use Trading Indicators?
Beginners may benefit more from learning a few indicators well than from filling a chart with technical tools.
Before adding an indicator, ask three questions.
What Does It Measure?
Is the indicator measuring trend, momentum, volatility, volume, or something else?
What Data Does It Use?
Understanding the calculation helps explain why the indicator responds in a particular way.
Why Am I Using It?
Every indicator should have a specific purpose within the analysis.
For example, a trader might use a moving average to understand the broader trend and RSI to assess momentum.
Neither has to determine the trading decision on its own.
Beginners can also practice observing how indicators respond under different market conditions in a demo environment before considering live trading.
Indicators Don’t Replace Risk Management
Even a strong technical signal can lead to a losing trade. That's why risk management is separate from indicator analysis. Depending on the trading approach, risk considerations may include:
- Position size
- Stop-loss placement
- Market volatility
- Total account exposure
- Available margin
- Risk-to-reward characteristics
An indicator cannot remove market risk or guarantee that a particular setup will succeed.
Understanding risk management in trading, and how tools such as a stop-loss work, is therefore essential regardless of the indicators used.
Technical indicators can support market analysis, but they cannot eliminate trading risk. The Financial Conduct Authority (FCA) provides guidance on understanding investment risks and the relationship between risk and potential returns before making financial decisions.
Conclusion: Why Indicators Don’t Predict Price
Trading indicators provide information about market trends, momentum, and volatility; however, they cannot predict price actions in the future. Trading instruments such as RSI, MACD, and moving averages use available market data for analysis and do not predict what will happen in the future.
It is not the objective of a new trader to look for the right indicator but to learn the functioning of the indicator and its limitation. Using indicators along with price action and risk management is helpful in developing a systematic approach to technical analysis.