
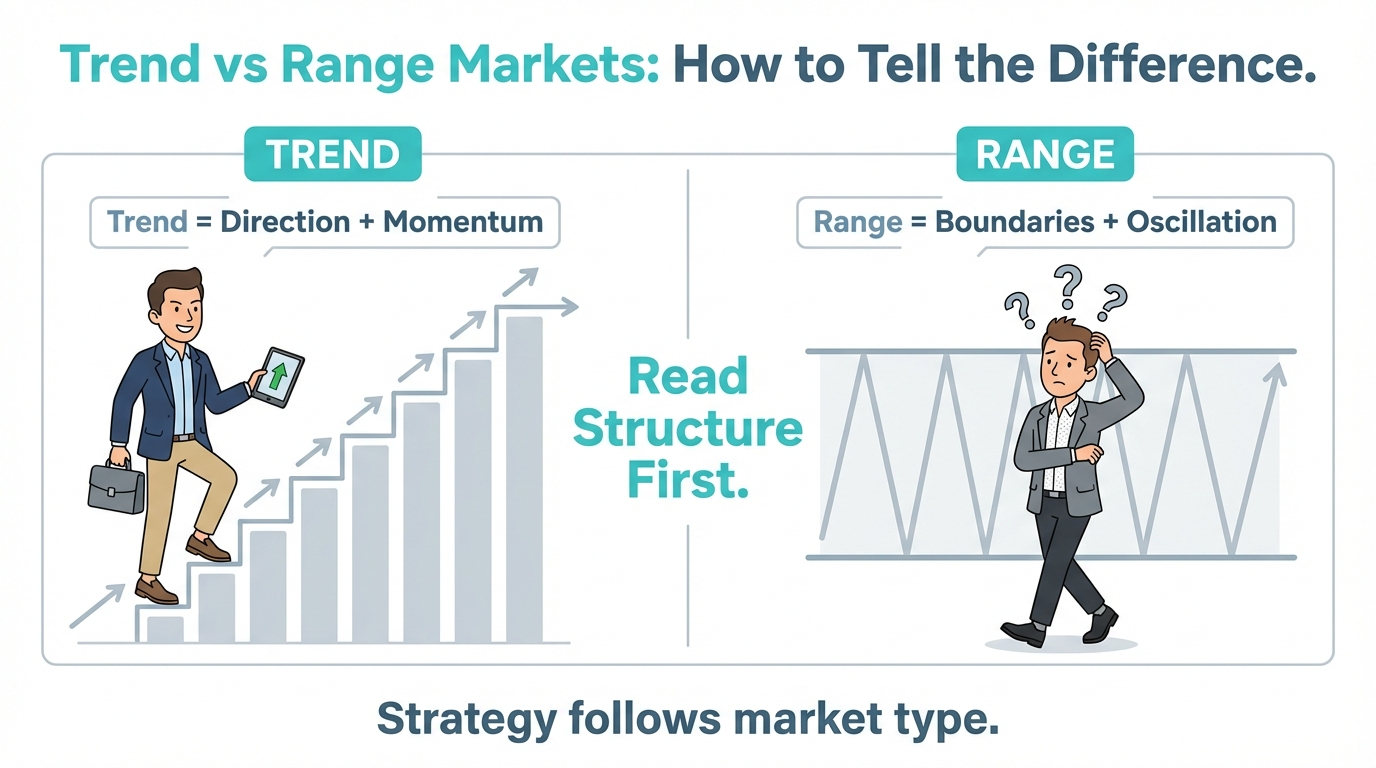
Financial markets do not always move in the same way. At times, prices move predominantly in one direction. At other times, they fluctuate within a relatively defined range.
Understanding the difference between trend vs. range markets is an important part of learning technical analysis.
A trading system created to function in trending conditions may show different results when prices tend to move sideways. Yet, understanding the state of the market doesn’t necessarily mean that a specific strategy will work well.
In this article, we’ll talk about trending and ranging markets, learn how beginners can detect them by their features, and why it’s important to understand market conditions when analyzing price charts.
Why Market Conditions Matter When Choosing a Strategy
The state of the market will determine the behavior of prices and even the effectiveness of the strategies employed in trading.
For instance, trend following is a strategy that involves taking part in sustained price trends in the market.
On the other hand, range trading is based on price movement in and around the level of support and resistance in the market. Nonetheless, not all strategies guarantee success and there is no surety that market states won't suddenly change.
Determination of market trends will help in determining the validity of the assumptions of analysis.
This principle connects directly to Chart Reading Basics, where identifying structure is the first step before making any trading decision.
Execution should always follow the environment, not the other way around.
What Is a Trending Market?
The trending market can be defined as the one in which the prices of an asset move upwards or downwards in the specified period of time. Despite the fact that there may be ups and downs during the trend formation process, the whole process has clear patterns that should be understood by the beginners.
Characteristics of Trend Markets
A trending market typically shows consistent directional price movement over a certain period of time.
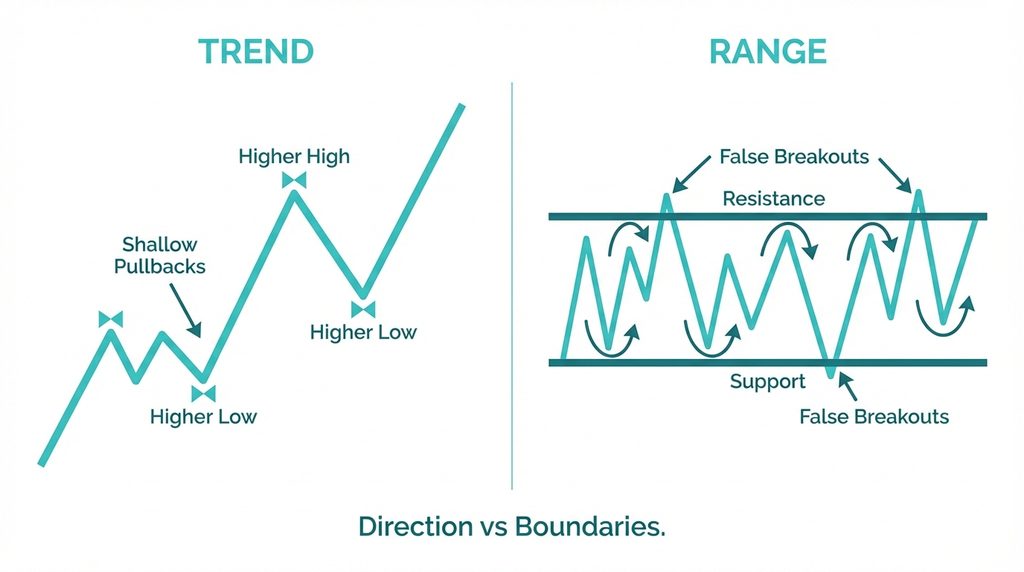
In an up-trend, prices might create higher highs and higher lows.
In a down-trend, prices might create lower highs and lower lows.
This describes the price movements that took place in the past. This does not determine the intentions of the buyers or sellers on its own. Trends can consist of temporary moves that go against the main trend. These are usually known as pullbacks.
Nevertheless, a pullback can become a more powerful reversal move, and the trend that was identified earlier might become obsolete. Past levels of support and resistance might be helpful while analyzing these price movements.
This behavior is explained in Support & Resistance Explained, where price reactions cluster around specific zones rather than moving continuously.
Trend structure reflects directional agreement among market participants.
What Is a Ranging Market
A ranging market refers to a market where the price moves sideways without having any defined direction or trend, either downwards or upwards.
In this case, the price usually fluctuates between some defined levels of resistance and support, forming a rather horizontal pattern of movement. The concept of a ranging market will help novice traders identify consolidation periods in price.
Characteristics of Range-Bound Markets
Generally, ranging markets tend to trade horizontally within a clearly defined range of high and low prices.
Low prices are usually termed as support levels, while high prices are usually termed as resistance levels.
Price action may come close to these levels many times before reverting back to the other side of the range.
Nevertheless, ranging markets do not necessarily mean that there is a balance in buying and selling pressures, nor that price action will stay within these defined levels. Prices can break through defined resistance or support levels to form a new trend.
Why Beginners Misread Trend vs Range Markets
Common Misinterpretations
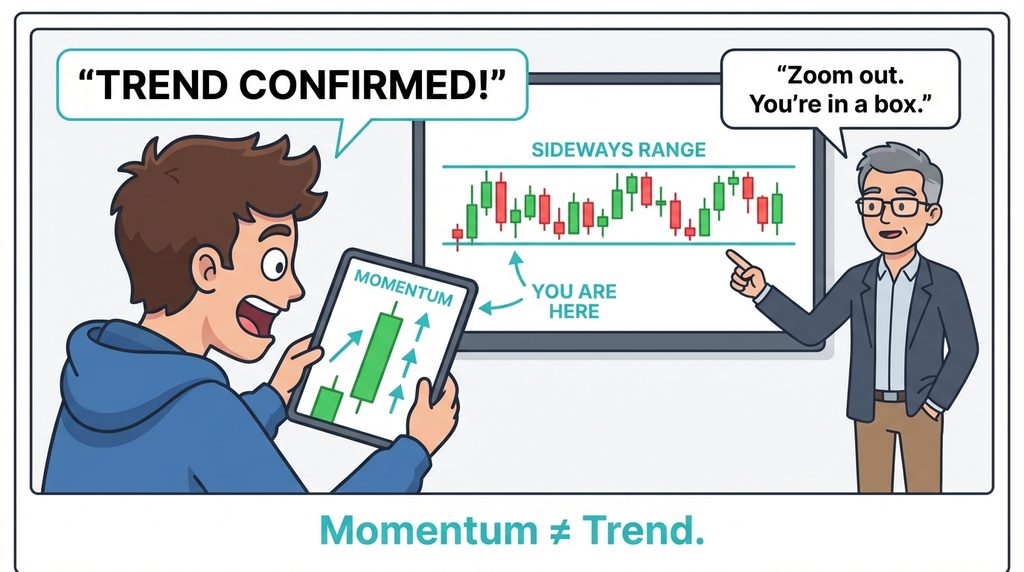
Price momentum in the short term is sometimes mistakenly considered a trend by beginners.
For instance, a series of bullish candles might be seen as indicating that prices are moving upwards in a relatively short time frame.
But if these movements are analyzed in a broader time frame, they may just constitute a fraction of the sideways trading range. This shows how the chosen time frame becomes important in understanding market structure.
Analysis across several time frames can give more insight, but different time frames can also have conflicting views. Knowledge of the information embedded in each candlestick can help beginners differentiate actual movements from expectations.
Understanding candlestick structure, as explained in Candlestick Anatomy Explained helps traders analyze price behavior more objectively rather than reacting emotionally.
Clarity improves when traders prioritize structure over speed.
How to Identify a Trend Market
Determining a trending market requires analyzing the price movement and determining if there is any pattern of rising or falling prices.
Traders may be able to analyze price tops, bottoms, and reversals to determine the bigger picture of the market structure. Trends are not always clear and easy to discern since price movements in the short term can create confusion about the trend.
Structural Confirmation
One of the techniques for spotting the beginning of a trend is the study of the history of recent highs and lows of the prices. For an upward trend, it could be seen as high highs and high lows; for a downtrend, low highs and low lows.
It is quite natural for there to be temporary divergences from the trend.
For instance, in the case of an uptrend, prices might drop temporarily before rising again. There is no one number of highs and lows that could indicate the presence of a trend on all instruments and time frames.
How to Identify a Range Market
Signs of Consolidation
The possibility of trading in a range may be seen if there are price movements that go from one fixed area to another regularly.
Prices do not form a sustained series of highs and lows but go back to previous levels. There may be overlapping candlesticks and price moves that do not create trend formations.
However, these factors are not necessarily found in all ranges, and prices may go beyond previous boundaries. A price move beyond support or resistance levels does not necessarily become a breakout.
Trends vs. Range Markets and Indicator Behavior
Why Indicators Give Conflicting Signals
Technical indicators rely on mathematical computations using existing market data including prices and volumes. There are different types of indicators for each type of price pattern.
For instance, moving averages could be used to identify price trends, whereas an oscillator like Relative Strength Index (RSI) could measure the price momentum.
Nevertheless, indicators might give contradictory signals in certain market situations.
While a trend indicator could lag behind the direction changes, an oscillator could stay high or low during a long trend. There is no indicator that would allow predicting future prices and determine definitely if the market will keep being either in a trend or range mode.
How Market Conditions Connect to Risk Management
Market Conditions and Financial Exposure
The conditions in the market may influence the underlying assumptions in a trading system.
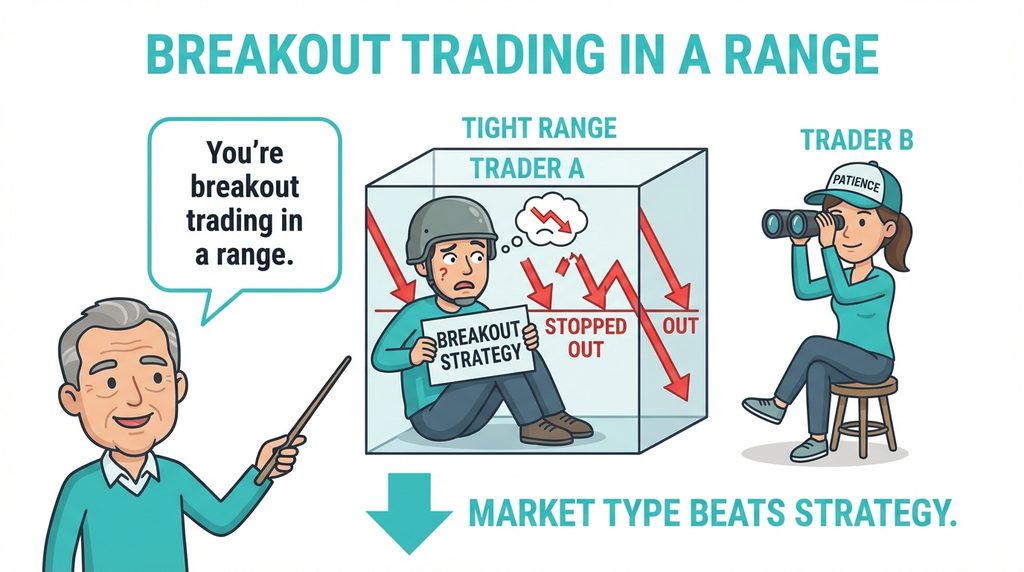
For instance, while a system built on the assumption of prolonged trends would experience problems during times of low volatility, trading in a range or going against the prevailing trend is not necessarily a mistake in terms of risk management. Risk in finance hinges on variables such as position size, leverage, volatility in the markets, and trading conditions among others.
Stop-loss order is one way of setting an exit point but cannot guarantee that one will be able to sell at that point. Knowledge of the market conditions could thus be part of a risk management exercise.
This concept connects with Risk Management Fundamentals where understanding market context is essential for managing risk effectively.
Professional traders tweak their involvement depending on the situation. They don't push trades when market structure isn't clear. Risk management includes knowing when not to trade.
Understanding market conditions is only one part of managing trading risk. The Financial Conduct Authority (FCA) provides guidance on investment risks, potential returns and the importance of understanding financial exposure before making investment decisions.
How Beginners Should Adapt to Trend vs Range Markets
Being aware of the way in which you can adapt yourself to the trends and ranging market environment is a vital element of developing your skills in reading charts.
Newbies are advised to know about various types of market conditions before thinking of how the trading system will perform in those environments. It is also helpful for traders to concentrate on market structure and possible risks instead of each price movement.
Practical Beginner Approach
Beginners can begin by studying how prices move under various market conditions.
For instance, they can study price movements during trending periods compared to those during which price moves in a confined range. Studying historical price action may offer some insight into how trends form, how ranges are formed, and changing market conditions.
In cases where demo accounts are available, beginners can use this tool to test their theories under risk-free conditions with virtual currency. However, it is worth noting that trading in demo accounts does not mimic live trading and psychological impact of real money.
Practice spotting market trends in a simulated setting to get better at recognizing patterns without risking your cash. You can safely check out these behaviors on the VARIANSE trading account page.
For a structured learning path, the VARIANSE Academy education page connects chart reading, market structure, and risk control to help traders build consistent habits.
Skill develops through observation and repetition.
How Market Conditions Change Over Time
The financial markets keep changing, and depending on how long it is observed, price action may change from trending to ranging.
Markets, which have been moving in one particular direction – either up or down, may start ranging, and vice versa – markets, which have been consolidating for some time, may start trending.
Recognizing these changes is important for beginner traders, who should understand that market conditions are not permanent.
Why Adaptation Matters
Financial markets can be ranging and trending alternatively. The ongoing directional trend can at some point slow down, turn, or become ranging.
Likewise, prices can breakout from the already formed ranges and start moving directionally.
Nevertheless, there is no predetermined time schedule when these transitions can happen. Some market situations can last very long, whereas other can change rather quickly. It is important to keep in mind the fact that markets can evolve in order not to fall into traps set by beginners.
Conclusion: Understanding Trend vs Range Markets
Two typical types of price action on the historical chart are trends and ranges. In trending markets, price usually has some trend direction, whereas range markets move around some identifiable price levels.
The ability to tell the difference between them will be helpful for traders starting to trade, as it will explain the behavior of different analysis methods. But there is no certainty about the market state; both trends and ranges cannot predict future price action.
Market structure is one of the aspects of trading education.