
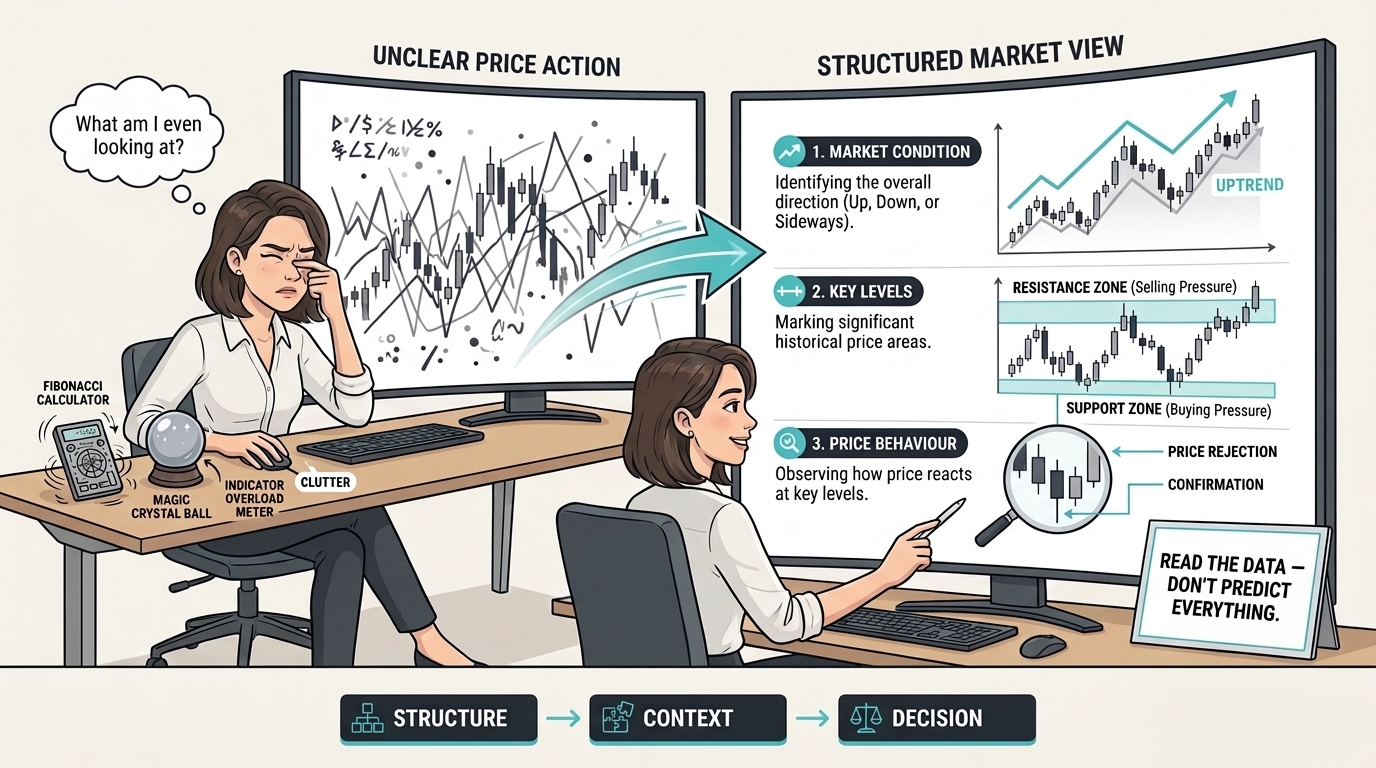
If you're learning chart reading basics, you may have noticed something frustrating: charts often look straightforward in hindsight but confusing in real time.
Financial graphs show historical market data in terms of price changes within various periods of time. Familiarizing yourself with how this information is structured may be helpful for beginner traders when analyzing graphs.
Charts do not serve as tools that would allow you to predict the future movement of the price of an asset. Charting involves studying the market environment, historical price behavior and limitations of such study.
Gaining the skill to differentiate between trends and ranges, identify possible levels of support/resistance and analyze candlesticks gives a good background for technical analysis. But no chart pattern will decrease your uncertainty or reduce the financial risks.
What Reading a Chart Actually Means
Reading a financial chart involves examining how an instrument's price has changed over time.
Beginners can start by considering three questions:
- Where is the current price relative to its recent history?
- Has the market generally been moving upwards, downwards or sideways?
- Are there historical price levels where notable movements or reversals have occurred?
The above points may help traders understand the market's recent performance without assuming past performance will repeat.
At the very beginning, traders tend to concentrate entirely on finding perfect chart patterns; however, recognizing the shortcomings of technical analysis is equally significant as pattern recognition.
In case when market situation is not clear, trading can be a risky choice.
Step 1 — Identify the Market Condition First (Trend vs Range)
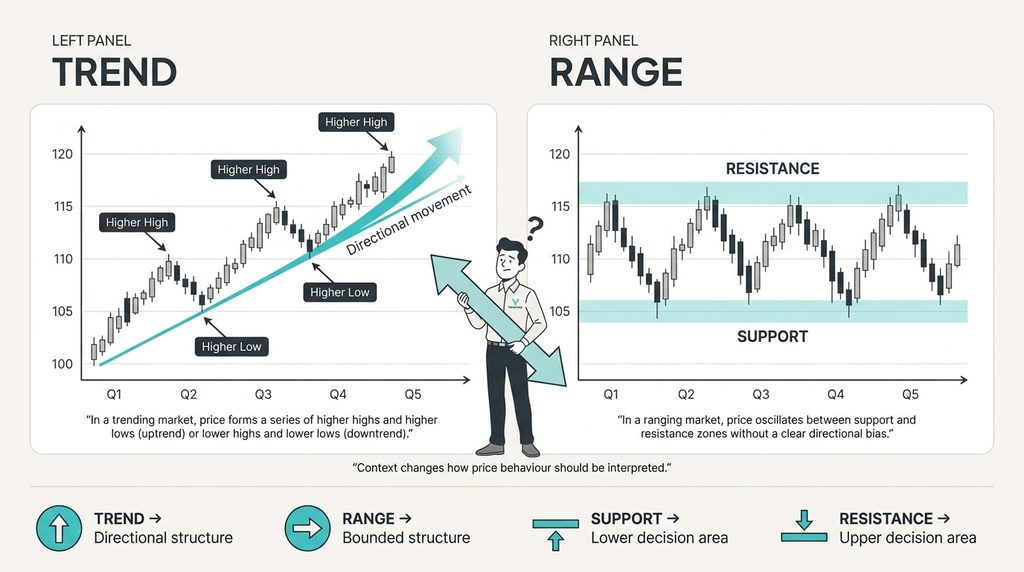
Prior to analysing the price action individually, take into account if there is evidence of either a trend or ranging market environment.
Trending market is normally described as exhibiting sustained directional move over the chosen time period.
The upward trend can feature successive peaks and troughs rising, while the downward trend – falling peaks and troughs.
Ranging market usually exhibits oscillation between identifiable upper and lower price boundaries without the formation of a sustained directional trend.
In Trend vs Range Markets: How to Tell the Difference? Trends reflect directional movement, while ranges reflect consolidation between highs and lows.
When traders misread conditions, they apply the wrong expectations. Trending markets reward patience, while ranging markets require precision. Understanding this protects both capital and confidence.
Step 2 — Identify Potential Support and Resistance Areas
Support and resistance are price areas where the market has demonstrated some significant reaction to before.
Generally, support is considered a region where there have been previous instances of slowing down of prices going downwards, stopping or reversal of prices.
On the other hand, resistance is a region where there have been previous instances of slowing down of prices going upwards, stopping or reversing of prices.
These areas are generally considered regions and not prices since reactions from the market may not happen at the same levels always.
But support and resistance do not mean that large numbers of buyers or sellers are located at these regions.
A clear breakdown is provided in Support & Resistance Explained, where levels are seen as decision points rather than precise lines.
These spots help merchants understand risk clearly. Traders watch where the market's already moved instead of just guessing. This switches trading from gut feelings to a more methodical, watchful approach. Levels provide context, not certainty.
Step 3 — Read Candlesticks in Context
Candlesticks show price information for a defined period of time.
A candlestick has four main levels, which are: the opening level, highest level, lowest level, and closing level. This information is useful by itself, but market conditions might affect traders' perception of this information.
For instance, when there is a big bullish candlestick, it means that prices closed higher than they opened in that period of time.
But the candle itself does not determine whether the following movement will be upward or downward. A candle appearing close to a historical support or resistance zone will draw more interest.
This concept is explained in Candlestick Anatomy Explained, where candles reflect the balance between buying and selling pressure within a timeframe.
A strong candle standing alone in the middle of nowhere usually means not much. The same candle at a key support level could mean the market's about to turn down or keep going up.
Candles mean something in context. Understanding this reduces emotional reactions to short-term movement.
Step 4 — Understand Why Indicators Lag Price
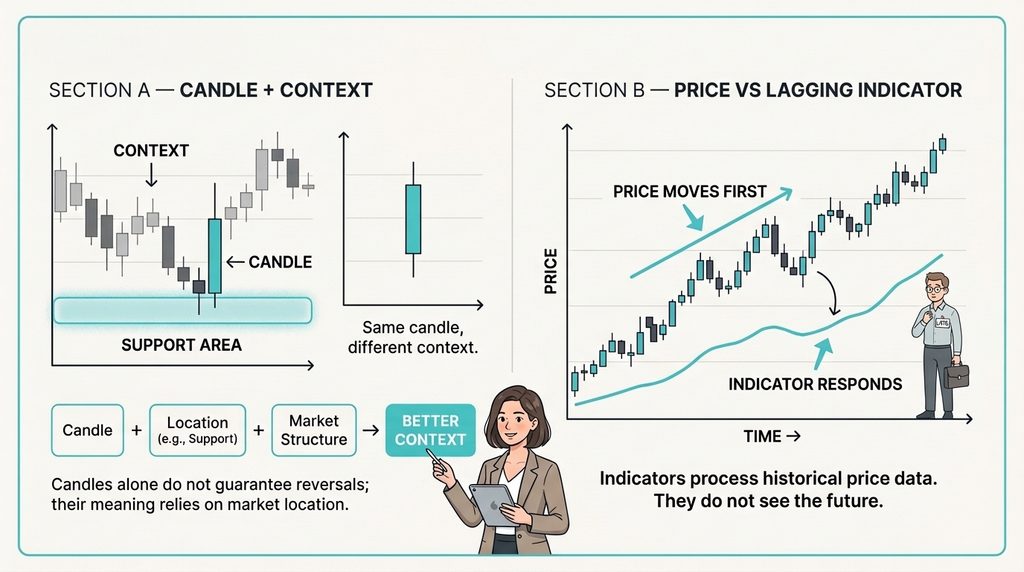
Technical indicators apply mathematical formulas that are derived from market information, for example prices (both historical and current) and trading volume when available.
Numerous indicators manipulate or modify price information so that trends, momentum or volatility become apparent.
Because their calculations depend on available information, indicators may not react to market developments immediately.
Some indicators try to anticipate turning points earlier than others; however, none can predict future market behavior.
Technical indicators can offer further insights into market situations, but their relevance depends heavily on their specific construction and the context in which they are used.
This principle is explained in Why Indicators Don’t Predict Price?, where indicators are framed as optional tools rather than predictive systems.
When indicator signals conflict with the price structure, the price should take priority. Price is the primary source of information. Indicators are secondary tools for interpretation. Over-reliance on indicators often creates confusion rather than clarity.
Step 5 — Read Price Clearly Without Overthinking
Overthinking often comes from using too many tools or seeking certainty. Simplifying your approach improves clarity.
This framework is explained in Reading Price Clearly Without Overthinking?, breaking down chart analysis into spotting the scene, where it's happening, and what's going on.
When traders narrow their focus to a handful of factors, their choices get better. Clear thinking reduces stress and prevents rash buying or selling. Simple observation is more effective than complex prediction.
How Chart Reading Connects to Risk Management
There is a connection between chart reading and risk management, but they have distinct roles. The purpose of chart reading is to assist the trader in studying past prices and finding interesting spots.
Risk management entails financial management and an awareness of the possible risks of trading.
For instance, historic price levels can be useful for determining the placement of a stop-loss.
However, proper position sizing will take into account account equity, planned money risk, the characteristics of the instrument, and the distance from the exit point. A stop-loss order cannot ensure that the order is filled at the desired price, especially when there is a gap or volatility in the market.
This relationship is laid out in Risk Management Fundamentals, where risk starts with understanding market structure. Poor chart reading leads to poor risk placement. Clear structure improves discipline and execution.
Understanding chart patterns is only one part of trading education. The Financial Conduct Authority (FCA) provides additional guidance on investment risks, potential returns and the possibility of financial losses.
How Beginners Should Practice Chart Reading
One way that beginners can build chart experience is through watching the behaviour of prices under various market scenarios and times. The first thing that beginners should try is to practice spotting trends, ranges, support and resistance zones, as well as candle formations.
Past experiences will help them understand where their analysis was flawed or distorted because of retrospection. If possible, the use of a demo trading account is another way to gain practice in using charting features and placing orders with virtual money.
Nevertheless, demo trading cannot replicate live trading and the psychological factor of real money on the line.
A VARIANSE demo account allows traders to practice without financial risk while observing real market behavior.
Check out VARIANSE Academy's education page for a learning path that takes you from chart reading to risk management and finally to execution. It's a step-by-step guide that'll help you level up your skills.
Conclusion: Chart Reading Basics for Beginners
The reading of charts is one of the key foundations of the analysis of how prices have evolved in finance.
Learning to discern between trends and ranges, determine support and resistance zones of history, and analyzing candlestick data is essential in establishing an organized strategy of technical analysis.
While technical indicators can offer an added dimension, it is impossible for them to forecast future prices. Chart analysis is also subject to other factors such as trade expenses, risk management, and trade execution environment.
However, the ultimate goal of studying chart reading is to make sense of the market data better and recognize uncertainty.