
Financial markets constantly change as prices respond to trading activity, available liquidity and new information.
During these movements, certain price areas may repeatedly coincide with pauses, reversals or changes in direction. In technical analysis, these areas are commonly described as support and resistance.
Support and resistance help traders identify historical price levels that may be relevant when examining market structure.
But these are not reliable forecasting indicators because the same level which was support or resistance before can act in a totally different way next time.
For starters, knowledge of all these notions is essential for analyzing the previous price behavior patterns without any assumptions about repetitions.
This idea is key to organized price analysis, as explained in Chart Reading Basics, with market structure serving as the basis for trading choices.
What Support and Resistance Really Are
Support and resistance are terms used to describe price levels based on past behavior in the markets.
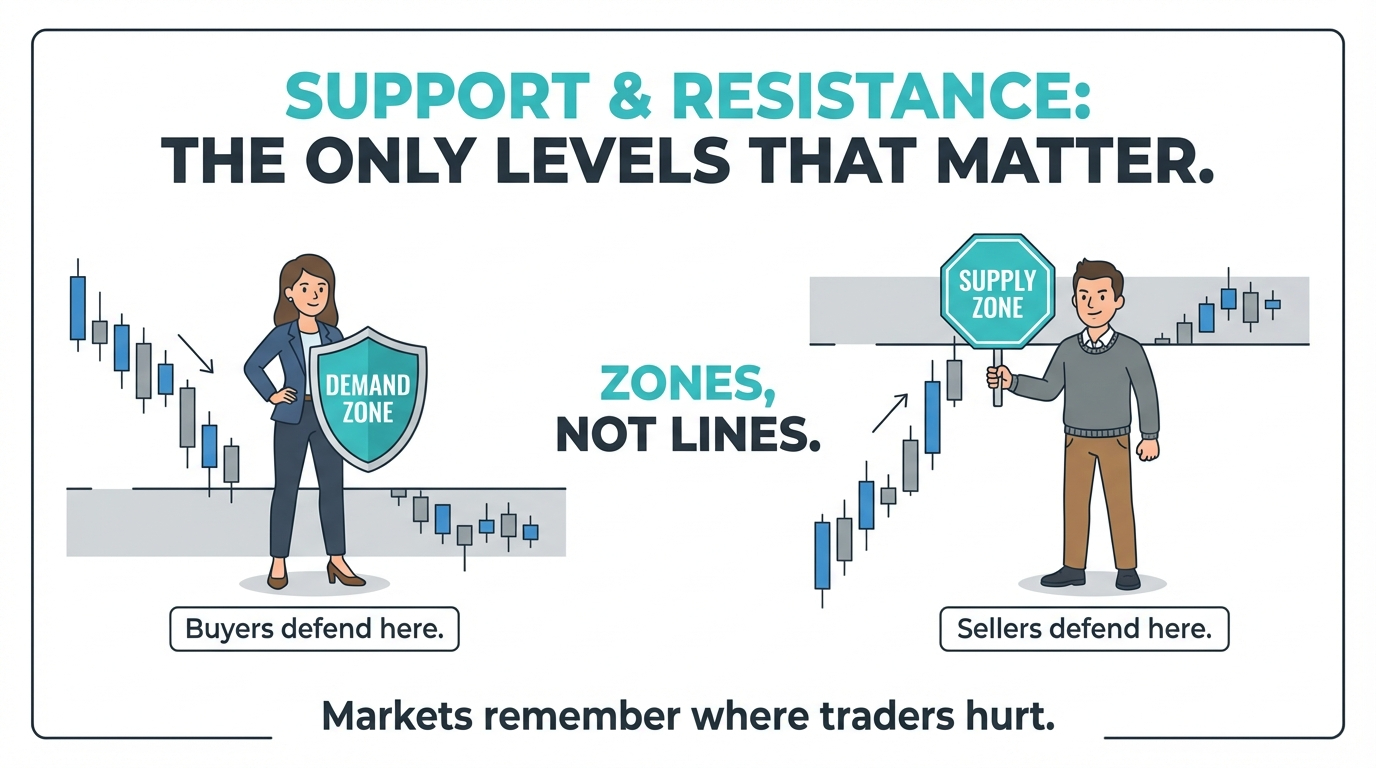
Support is usually a price level that lies below the present price in the market and which in the past has caused the downtrends to slow down or reverse.
Resistance, on the other hand, is a price level above the present price in the market which in the past has caused the uptrends to slow down or reverse.
Such levels may be helpful for traders to determine the past behavior of the prices at those levels.
But support and resistance do not separately give information about the number of buyers and sellers, volume of orders placed, or intentions of the market participants.
Why Support and Resistance Matter in Financial Markets
Support and resistance give reference points for analysis of price behavior in the past.
For instance, there could be occasions where a market reaches a certain price level but then changes its course.
This kind of information can assist in determining the levels at which prices have behaved in the past.
It is, however, important to note that even when this happens, it does not explain why prices changed and ensure that the same will happen again. There could be many other factors affecting the price behavior like liquidity in the market, expectation and economic announcements.
Thus, support and resistance should be used as a component of chart analysis.
Support vs Resistance Explained Simply
Support and resistance are two fundamental concepts in technical analysis that help traders identify important historical price areas.
While support refers to areas where downward price movements have previously slowed or reversed, resistance highlights areas where upward movements have encountered similar reactions.
Understanding the difference helps beginners interpret market behaviour and recognise potential turning points without assuming that prices will react the same way again.
Support Levels
Support forms below the current price and acts as a zone where the price slows or halts. Buyers often re-enter near support, while sellers may exit. This doesn’t guarantee a reversal; it’s a historically significant area reflecting prior buying interest.
Resistance Levels
Resistance resembles a barrier that the price previously struggled with. Sellers may enter as the price approaches resistance, while buyers hesitate.
This often leads to consolidation or reversal, though continuation is possible if buying pressure is strong. Resistance reflects prior selling interest.
How Support and Resistance Levels Are Formed
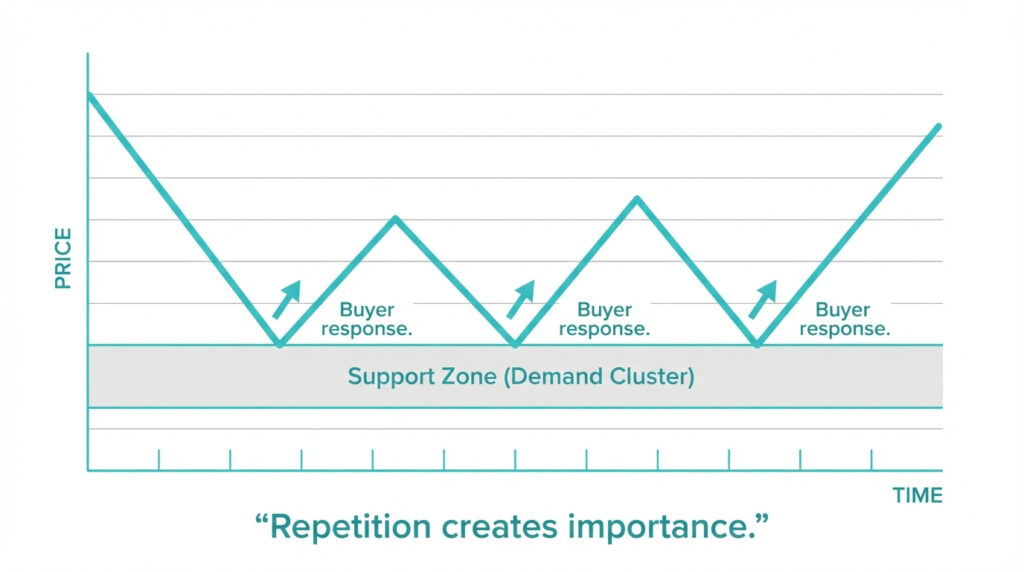
Repeated Reactions Create Importance
Support and resistance levels can usually be determined by looking at past price action. The traders can check price movements at which the price had slowed down or changed its direction.
These areas may appear around past highs, lows, or any other important price action. While repeated responses can make the level more apparent, it doesn’t always mean that the level will stay significant.
This behavior ties right into Candlestick Anatomy, showing how traders react at crucial points. Markets remember where decisions happened.
Support and Resistance Are Zones, Not Just Lines
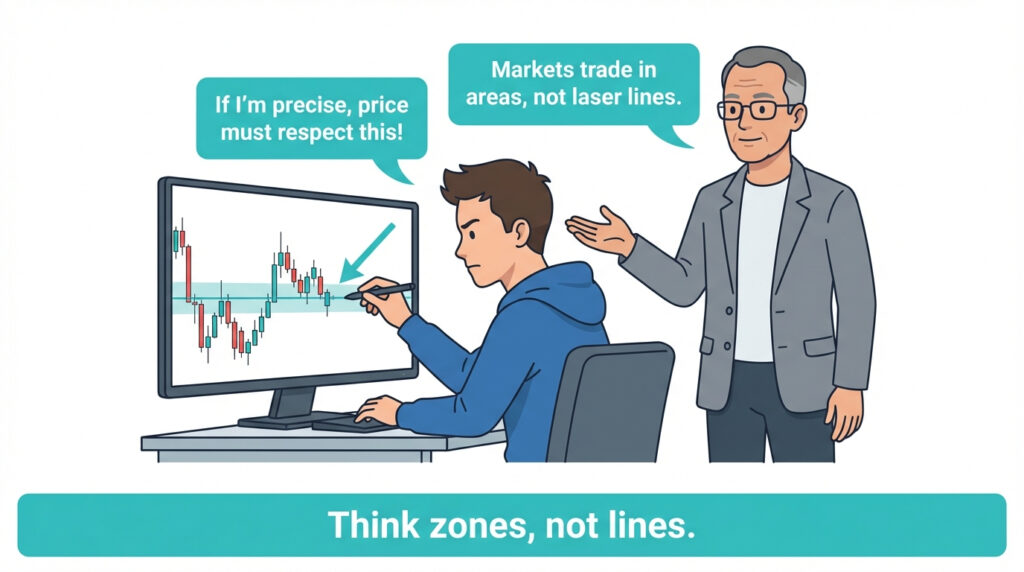
Why Precision Is Misleading
Support and resistance levels are frequently depicted on trading charts as horizontal lines.
Nonetheless, the price response in the past is not necessarily going to happen at the exact same price level. That is why some traders find it better to focus on the price range rather than just one price level.
For instance, a number of lows that have taken place in a tight price range may be considered an area of support.
Lines and zones do not assure price reversal, and picking one of them will not necessarily minimize risks in trading.
Role Reversal: When Support Becomes Resistance
Support and resistance levels do not always maintain the same role in financial markets. When prices move beyond an established support or resistance area, that level may begin acting in the opposite way.
This behaviour is known as role reversal and helps traders understand how historical price levels can influence market structure. However, these changes are not guaranteed, and previous levels may not produce the same reactions when revisited.
How Previous Price Levels May Change Function
In technical analysis, role reversal occurs when what used to be a support area becomes a resistance area, or vice versa.
This means that when prices fall below a particular support area, the trader can see if future increases in price will meet resistance at that same point.
Alternatively, a resistance area can become a support area once prices rise above it. These transitions do not always happen.
Support and Resistance in Trending vs Ranging Markets
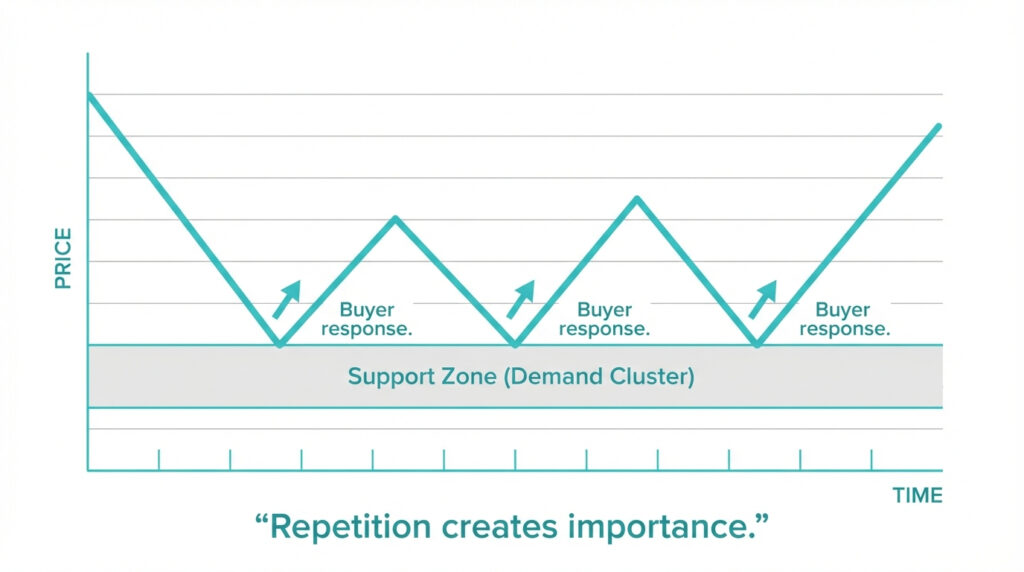
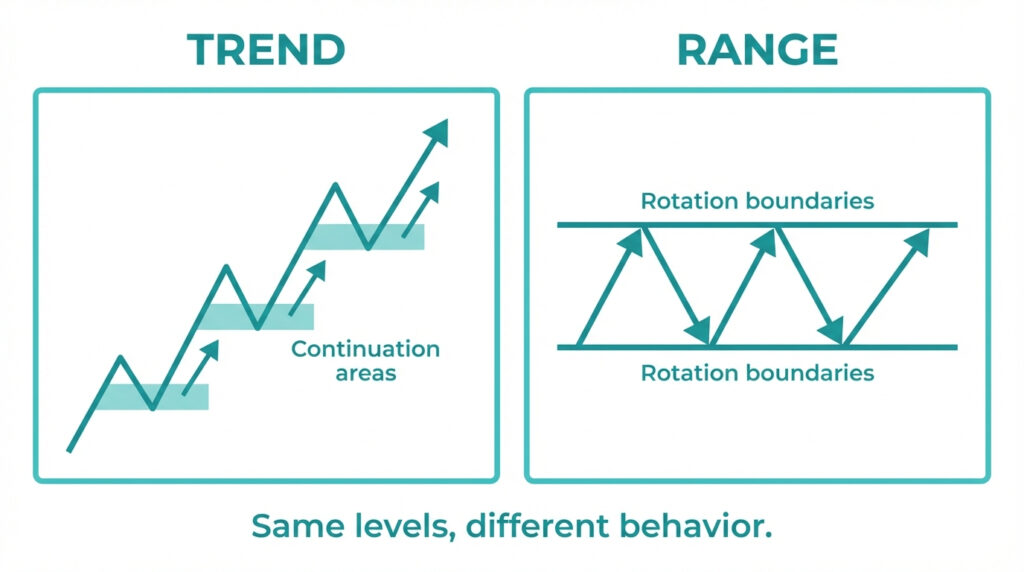
How Market Conditions Affect Price Levels
Support and resistance can be observed in both trending and ranging markets.
In a trending market, the trader can see how the price moves around previous highs, lows, and possible retracement areas.
In a ranging market, the price can be seen moving back and forth between support and resistance levels.
Yet, there is an unexpected element to trading as well because market conditions can change and old levels may not affect the price movement anymore.
This relationship is explored in more depth in Trend vs Range Markets, where understanding the market's vibe helps you interpret those levels. Context determines probability.
Common Beginner Mistakes With Support & Resistance
Understanding support and resistance is an important part of learning technical analysis, but beginners often misinterpret how these price levels work.
Common mistakes include treating support and resistance as guaranteed reversal points, drawing too many levels on a chart and ignoring broader market conditions.
Recognising these mistakes helps traders develop a more structured approach to chart reading and understand the limitations of historical price patterns.
Misunderstanding Their Purpose
One of the mistakes is the assumption that support and resistance are fixed prices at which the market will reverse.
Actually, it is possible that the price can go beyond the identified level but still not make any kind of reversal.
Too many levels could also be marked on a chart to such an extent that it becomes impossible to distinguish between historical price levels and regular price movements. It is assumed by beginners that recurring price actions at certain levels ensure the holding of these levels.
How Support and Resistance Connect to Risk Management
Support and resistance levels can provide useful reference points when evaluating potential trading risks. By examining historical price reactions, traders can identify areas that may help inform entry decisions, stop-loss placement and potential exit levels.
However, these levels do not guarantee price movements or prevent losses. Effective risk management also requires appropriate position sizing, an understanding of market volatility and awareness of execution risks.
Using Historical Price Levels to Inform Risk Decisions
Support and resistance might enable the trader to find price levels that would be significant for his analysis.
For instance, a trader looking into entering a long trade might analyze historical support in determining the level of exit from the trade.
Similarly, a trader analyzing short trade may take into consideration historical resistance. But that does not necessarily mean that those levels will serve as the right place for setting a stop-loss order.
A stop loss is an order placed in advance to get rid of the position whenever a particular trigger is achieved. This will either imply selling or buying depending on the position one intends to enter.
Stop loss orders cannot always ensure execution at a certain price especially in case of gaps or volatility in the market.
Suitable position sizing will depend on such factors as account balance, amount of risked money, details of the financial instrument and distance from the exit point.
This ties right into Take Profit & Stop Loss Explained, where you make exit decisions based on strategy rather than gut feelings. Once you get the hang of spotting the right level, sizing your positions gets easier, as the article Position Sizing Explained points out, because you can measure risk. Structure makes risk controllable.
Understanding historical price levels does not eliminate the possibility of financial losses. The Financial Conduct Authority (FCA) provides educational guidance on investment risks and the relationship between risk and potential returns.
How Professionals Use Support and Resistance
Analytical Reference Points, Not Prediction Tools
Some traders with experience use support and resistance as part of their market analysis. They can look at the past price levels along with other aspects like trends, volatility and liquidity.
Nevertheless, there is no single approach that is used by all professionals. Support and resistance could be considered as points of references in the case of possible future price actions.
Traders consider multiple levels alongside trend, price swings, and liquidity. At VARIANSE Academy, the emphasis is on methodical, structured trading rather than guesswork. Levels guide decisions they don’t dictate them.
How Beginners Should Practice Support and Resistance
Learning to identify support and resistance requires practice, observation and an understanding of historical price behaviour.
Beginners can start by examining trading charts, marking areas where prices have previously reacted and comparing these levels across different timeframes.
Observing how prices behave around these areas helps develop chart-reading skills while reinforcing that support and resistance are reference points rather than guaranteed signals of future price movements.
Building Understanding Through Observation
Beginners can begin by looking at the old charts and recognizing places where prices have already slowed down, halted or turned around before.
Comparison of such observations through various periods will be able to show beginners how support and resistance might look different based on what period is being considered.
Beginners can also analyze situations when the prices went past certain levels recognized before.
If possible, beginners can use a demo account that will create an opportunity to practice trading through virtual money. Nevertheless, the simulated trading will not be able to imitate real trading conditions completely.
Practicing in a risk-averse environment builds confidence and understanding. You can check out VARIANSE trading on their site, and it's a great way to see how the market's doing without worrying about your wallet.
Skill develops through repetition.
Conclusion: Support and Resistance Explained
Support and resistance are tools frequently employed within technical analysis as a means of locating historically significant points of price reversal.
Typically, support is understood to be a point of slowing or reversal of price decline, whereas resistance represents slowing or reversal of a rising price. The significance of such points can be helpful in assessing trends, ranges, and market structure.
But support and resistance, in and of themselves, do not shed light on the intentions of market players or predict future prices.