
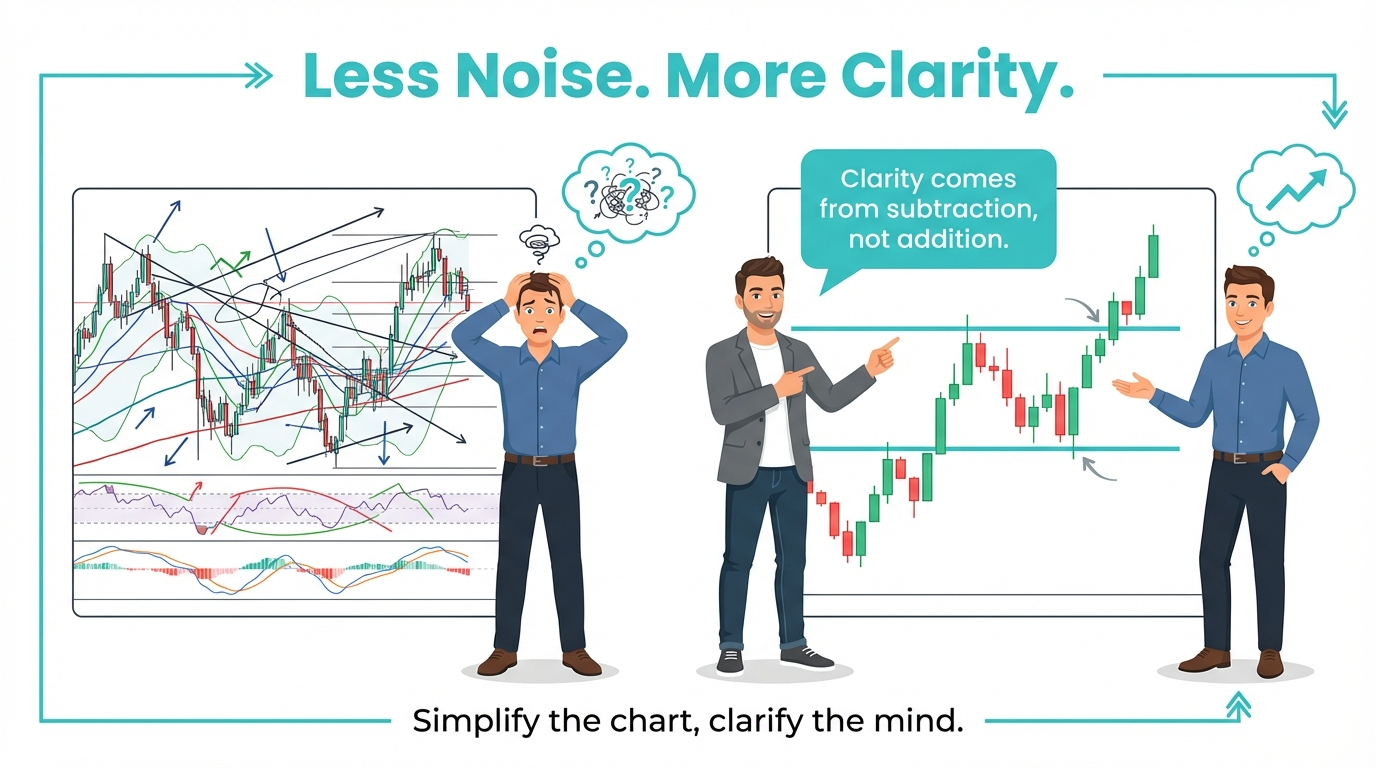
A trading chart can look complicated surprisingly quickly. Add various indicators, trend lines, support and resistance levels, and numerous timeframes, and a beginner can end up with more information but less clarity.
Reading price clearly without overthinking starts with something simpler: understanding what price itself is doing.
Price action can show whether a market is trending, ranging, breaking an important level, or changing behavior. Traders don't need to interpret every candle or predict every move. The goal is to identify the market information that matters and ignore what doesn't.
This guide shows beginners how to read price action more clearly using market structure, trends, and key price levels without unnecessarily complicating their charts.
What Does Reading Price Action Mean?
Price action refers to a market's price movement over time.
On a candlestick chart, that movement creates highs, lows, trends, ranges, breakouts, and reactions around particular price areas.
Reading price action means observing those behaviors and asking straightforward questions:
- Is price generally moving higher or lower?
- Is the market moving sideways?
- Where has price previously changed direction?
- Has an important high or low been broken?
- Is the current movement consistent with the broader market structure?
The goal isn't to interpret every candle. It is to understand the market's broader behavior before focusing on smaller details. This is a foundation of Technical Analysis for Beginners.
Start With Market Structure
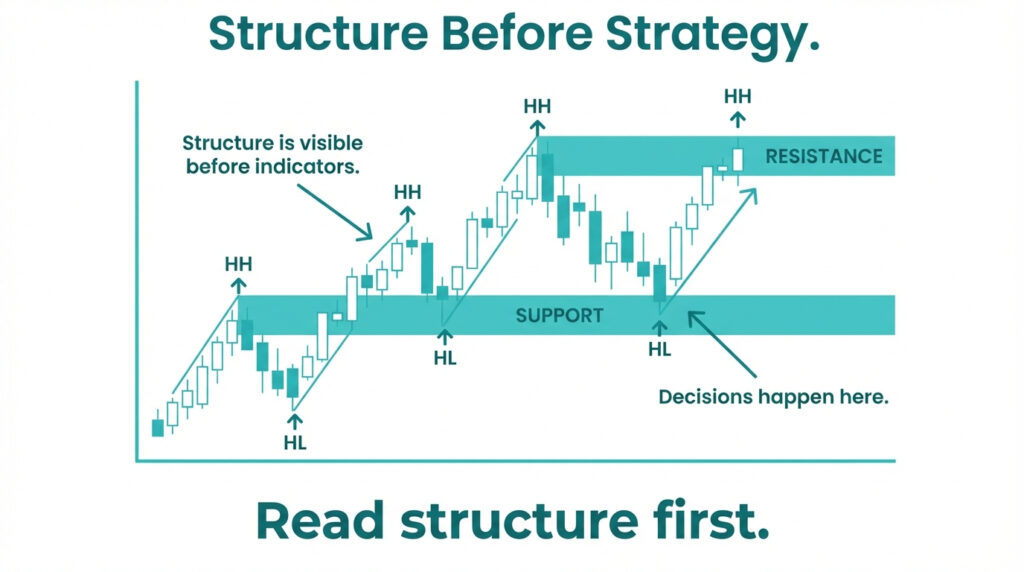
One of the simplest ways to make a chart easier to read is to examine Market Structure Explained. Market structure describes how price forms highs and lows over time.
Higher Highs and Higher Lows
When price repeatedly forms higher highs and higher lows, the market may be displaying an uptrend.
For example, imagine price rises from $100 to $110, falls to $105, then rises to $115.
The new high is above the previous high, while the pullback remains above the previous low. Rather than analyzing every candle between $100 and $115, the trader can first recognize the broader upward structure.
Lower Highs and Lower Lows
The opposite pattern can indicate a downtrend.
If price repeatedly forms lower highs and lower lows, the market may be displaying a downtrend. This pattern describes the direction of historical price movements without independently revealing the intentions of buyers or sellers.
Suppose price falls from $100 to $90, recovers to $95, and then falls to $85.
The recovery fails to reach the previous high, and price subsequently creates a new low.
Identify Whether Price Is Trending or Ranging
Not every market forms a clean trend. Sometimes price moves sideways between relatively clear upper and lower areas. This is commonly described as a trading range or consolidation.
Recognizing this distinction matters because the same price movement can mean different things in different environments. A pullback during an established uptrend, for example, has different context from a similar downward move inside a sideways range.
Before looking for smaller patterns, ask:
Is the market trending, ranging, or transitioning between the two?
This simple question can reduce unnecessary analysis because it establishes context before individual signals are considered.
Focus on Key Price Levels
Once the broader structure is clear, traders can identify areas where price has previously reacted meaningfully.
These may include:
- Previous swing highs
- Previous swing lows
- Support areas
- Resistance areas
- Range boundaries
- Previous breakout areas
The objective is not to mark every historical turning point. Too many horizontal lines can make a chart harder to interpret. Instead, focus on key price levels where the market has demonstrated a clear reaction or where the level is relevant to the current structure.
For example, if price has repeatedly struggled to move above the same area, that zone may provide useful resistance context.
If price approaches it again, the trader can observe what happens rather than automatically assuming price will reverse.
Think in Zones, Not Perfect Prices
Markets rarely react at exactly the same number every time.
A beginner might draw support at 1.2500 and assume that price reaching 1.2498 means the level has failed. That can make chart reading unnecessarily rigid. Support, resistance, and other important levels are often better considered as zones.
Price can move slightly above or below an area before reversing, consolidating or continuing through it.
Thinking in zones can help traders examine price behaviour around historical areas rather than focusing exclusively on exact numbers. However, zones do not guarantee that prices will reverse, and their usefulness depends on the instrument, timeframe and analytical approach.
Read the Context Before the Candle
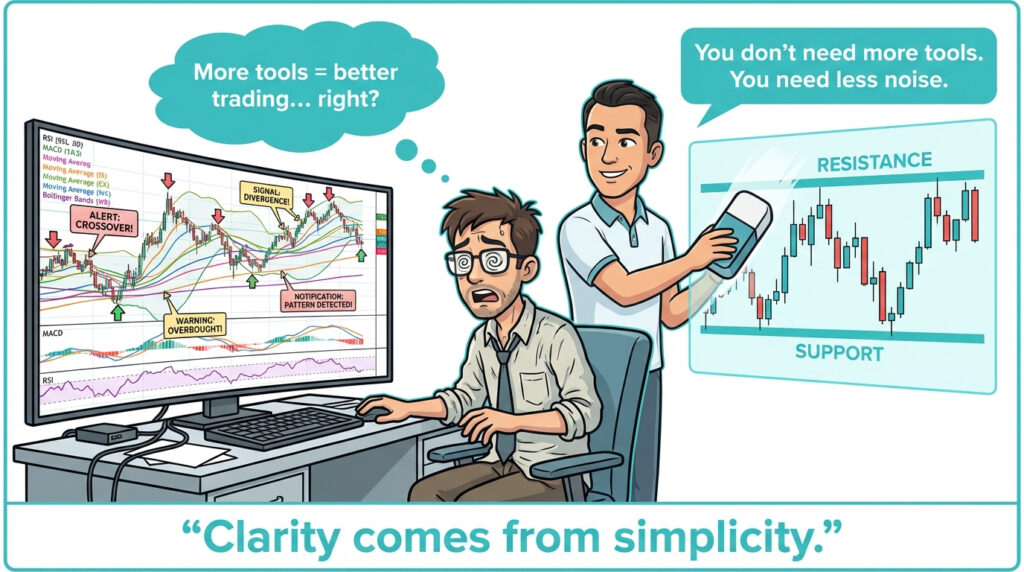
Candlesticks can provide useful information, but a single candle rarely tells the complete story. Imagine a large bullish candle appears.
On its own, it may look positive. But its meaning changes depending on where it occurs.
A bullish candle forming after a decline near an established support area has a different context from the same candle appearing directly beneath significant resistance.
Before interpreting a candle, consider:
- Where is it forming?
- What was price doing beforehand?
- What does the broader structure look like?
Broader market context helps traders interpret individual price movements without assuming that a single candlestick reliably predicts what happens next.
This is why learning price action for beginners should involve more than memorizing Candlestick Anatomy Explained names.
Don't Analyze Every Price Movement
Financial markets constantly move. Not every movement represents a meaningful change in market structure.
Short-term fluctuations can create market noise, particularly on lower timeframes. Trying to explain every candle can lead traders to keep changing their interpretation.
Suppose a market remains in a broader uptrend but produces several small bearish candles during a pullback.
Those candles do not automatically mean the entire trend has reversed. The more useful question is whether the movement has changed something structurally important.
- Has a significant low been broken?
- Has price left its established range?
- Has the sequence of highs and lows changed?
Separating meaningful structural changes from ordinary fluctuations can make charts considerably easier to read.
Avoid Overloading the Chart With Indicators
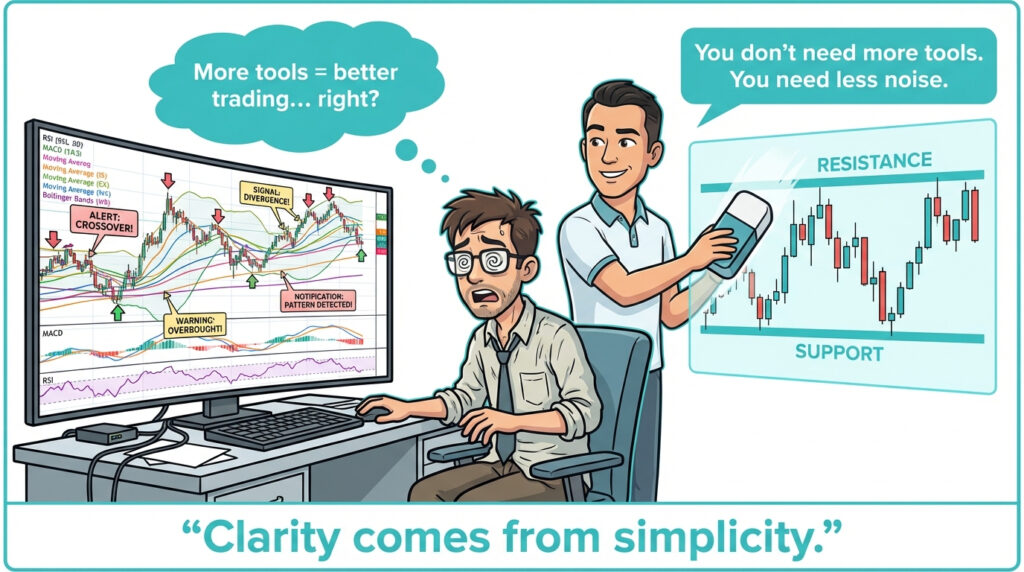
Indicators can be useful, but adding more tools does not automatically create clearer analysis.
A chart containing several moving averages, RSI, MACD, Bollinger Bands, and multiple oscillators may produce more signals than a trader can use effectively. It can also create contradictions.
One indicator may appear bullish while another appears bearish, prompting the trader to seek additional confirmation.
Before adding an indicator, ask:
- What information does this provide that I cannot already see or measure?
- If the answer is unclear, the indicator may just add complexity.
- Indicators can complement price analysis, but they should have a defined purpose.
Be Careful With Multiple Timeframes
Looking at multiple timeframes can provide valuable context, but constantly switching between them can also create confusion.
A market can appear bullish on a five-minute chart, bearish on an hourly chart, and sideways on a daily chart. None of those observations necessarily contradicts the others. They simply describe price over different periods.
Beginners may find it easier to choose a primary timeframe for their analysis and use a higher timeframe for broader context. Another timeframe should answer a specific question, not keep you searching until a preferred market view appears.
Use a Simple Price-Reading Process
A repeatable process can reduce the temptation to analyze everything on the chart.
Before considering a trading setup, work through four questions.
1. What Is the Market Structure?
Identify the important highs and lows. Is price broadly moving upward, downward, or sideways?
2. Where Is Price Now?
Determine whether price is near an important support, resistance, swing, or range area.
3. What Is Price Doing There?
Observe whether price is slowing, consolidating, moving beyond the area or reversing direction. These observations describe price behaviour rather than confirm what will happen next.
4. What Would Change the Analysis?
Identify what price would need to do for the current interpretation to become less valid.
This final question is particularly useful because it discourages traders from becoming attached to one market view.
Why Overthinking Can Hurt Trading Decisions
Overthinking often begins with the search for certainty. A trader sees a possible setup but wants one more indicator, another timeframe, or another pattern before deciding.
More information can feel safer, but it can also create analysis paralysis. Conflicting signals may lead to hesitation, constantly changing interpretations, or abandoning a structured approach.
Trading always involves uncertainty. The goal of analysis is therefore not to remove uncertainty completely. It is to organize available information into a framework that can support consistent decision-making.
Clarity usually comes from knowing which information matters not from analyzing everything available.
Conclusion: Reading Price Clearly Without Overthinking
Reading price clearly starts with understanding market structure, identifying key price levels and recognising broader market conditions. Beginners do not need to analyse every candle or rely on multiple indicators to interpret price movements.
A simpler chart can help reduce unnecessary distractions, but it cannot eliminate market uncertainty or guarantee better trading decisions.
Understanding price action is only one part of managing trading risk. The Financial Conduct Authority (FCA) provides guidance on investment risks and the relationship between risk and potential returns, helping beginners understand why risk assessment matters before making trading decisions.