
Technical analysis is often associated with chart patterns and indicators, but its practical purpose is broader. It involves studying price movements, identifying market conditions and developing trading scenarios using information from charts.
For beginners exploring Forex and CFD trading, technical analysis can provide a structured way to evaluate potential opportunities and consider risk. However, charts cannot reliably predict future prices, and leveraged trading can magnify both gains and losses.
The goal is not to find a perfect prediction. It is to understand what price is doing, identify relevant market levels and recognise when a trading idea may no longer be valid.
What Technical Analysis Actually Means (Without the Hype)
Technical Analysis examines how prices move using charts. It focuses on repeatable elements: structure, levels, momentum, volatility, and market context.
A practical definition: Technical Analysis is a tool that helps you spot likely scenarios and manage risk when you’re not sure what will happen.
Technical analysis should always be accompanied by an understanding of market risk. The Commodity Futures Trading Commission (CFTC) provides independent investor education and guidance on recognising trading risks, helping beginners understand why chart analysis alone cannot guarantee profitable outcomes.
Pillar 1 — Market Structure: Understanding Price Behaviour
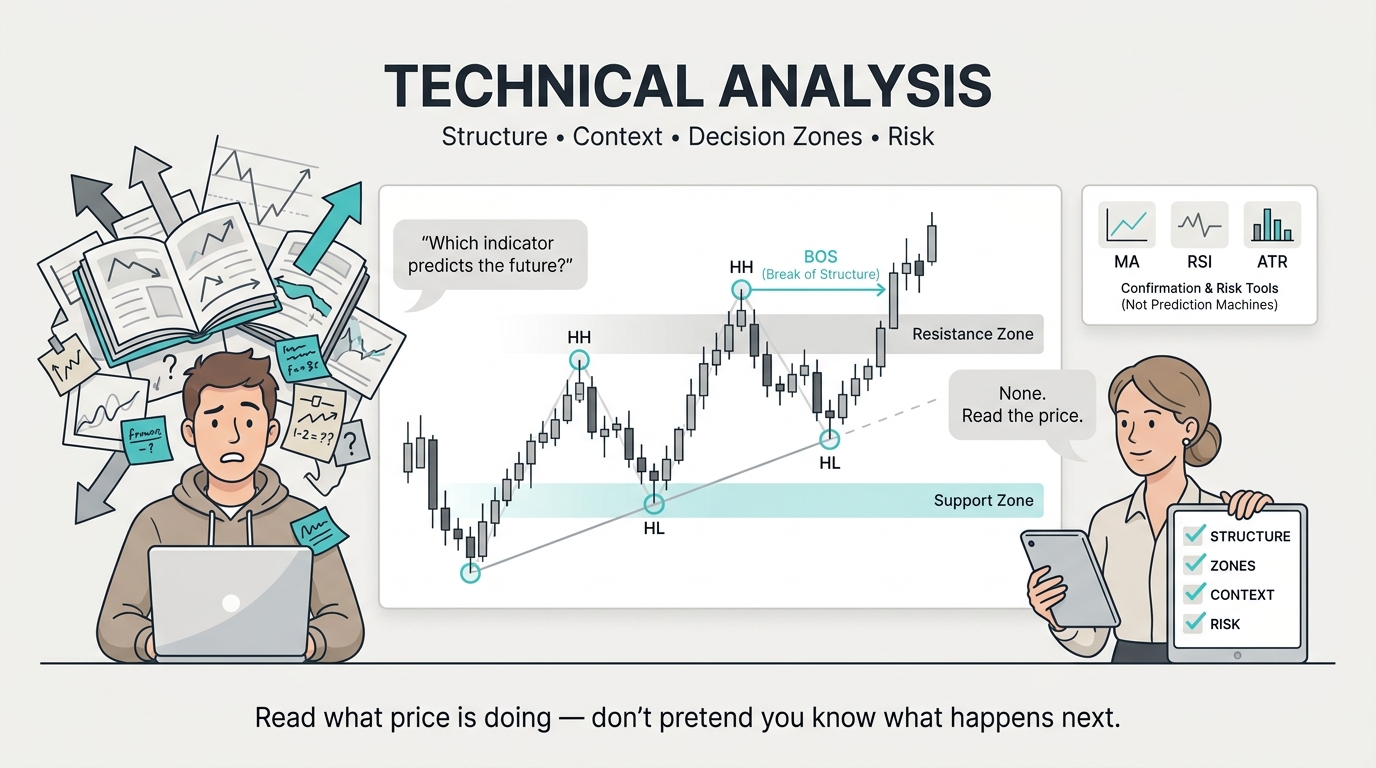
Market Structure refers to the pattern of highs and lows that price makes through time. Such patterns will enable traders to determine if the market is in an uptrend, downtrend, or in consolidation.
For instance, rising highs and rising lows may denote an uptrend, whereas falling highs and falling lows may denote a downtrend.
Such patterns explain what price does, not who dominates the market.
This foundation is developed in Market Structure Explained where Higher Highs/Higher Lows and Lower Highs/Lower Lows are treated as the core “grammar” of price.
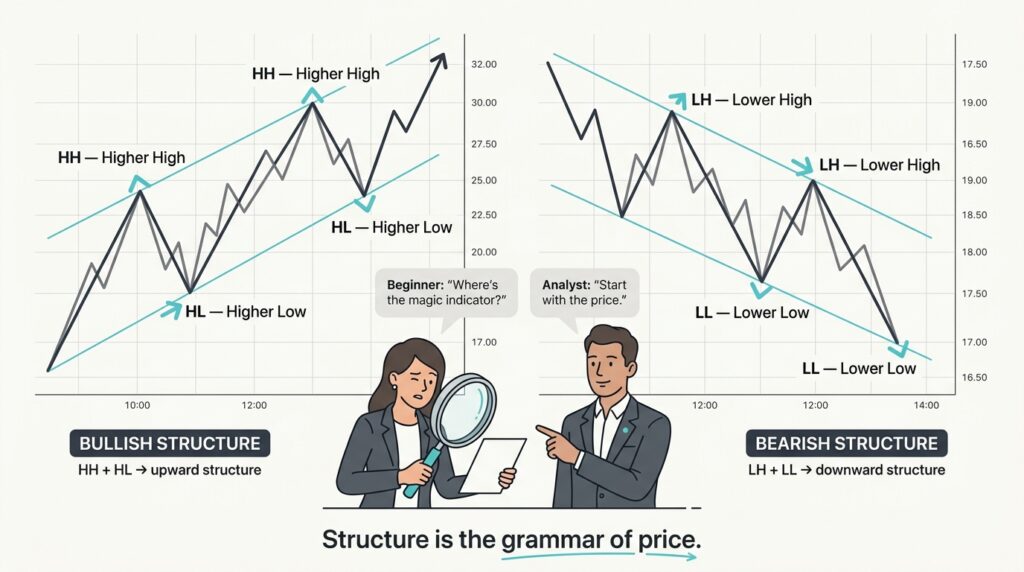
Before we plan or build strategies, price sets the structure. The structure of the market shows who’s calling the shots and whether the trend is picking up steam or fizzling out.
Why HH/HL and LH/LL Matter More Than Signals
Sequences of higher highs (HH) and higher lows (HL) can indicate an upward trend, while lower highs (LH) and lower lows (LL) can indicate a downward trend.
These patterns make it easier for traders to understand price action in a larger context. But markets can change, and there is no guarantee that any particular pattern will sustain a trend.
Pillar 2 — Break of Structure: Recognising Potential Trend Changes
Break of Structure (BOS) is an event that takes place when the price goes past a certain structural point like swing highs or swing lows.
According to the particular trading strategy, it may indicate a trend continuation or a probable shift in market conditions. Nevertheless, Break of Structure does not mean that there is a reversal or an opportunity for a trade.
This can be used together with other factors.
This is laid out pretty straightforwardly in the book Break of Structure & Market Regime Shifts, where BOS is seen as a way to manage risk first, aiming to cut down on bias and make decisions tighter, not just a quick way in.
BOS vs Trend Continuation Thinking
A structural breach needs to be understood in context with the prevailing trend and the importance of the structure which is being breached.
For instance, an upper breach of the recent swing high in an uptrend can be considered a continuation pattern, whereas a lower breach of the important swing low might mean that traders need to question their bullish stance.
None of the two guarantees what comes next; hence, risk assessment cannot be based purely on structural considerations.
Pillar 3 — Support and Resistance
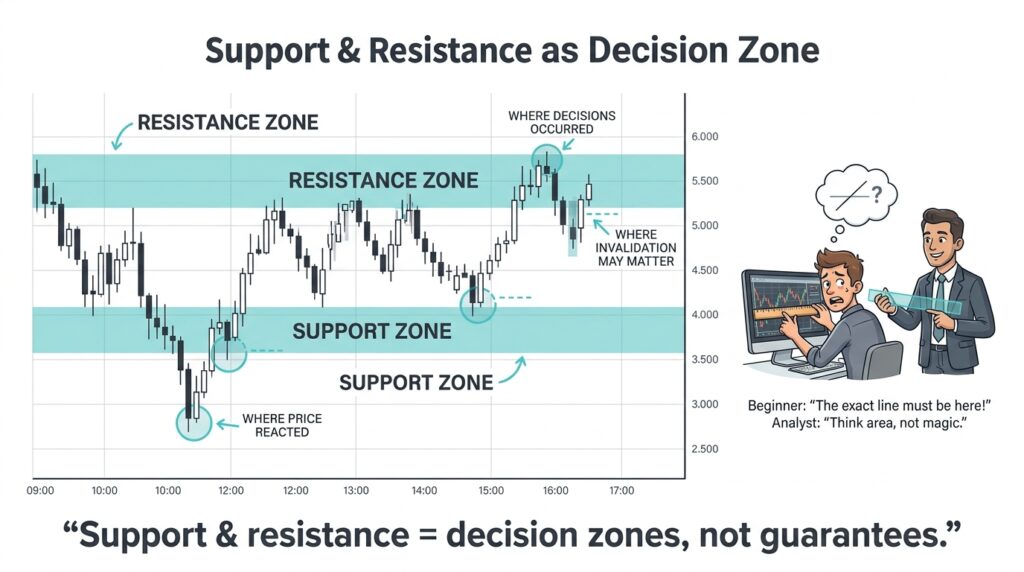
Areas of support and resistance are those points at which buying or selling interest from the markets was previously observed.
As opposed to regarding support/resistance as specific barriers, investors may use them as zones and try to interpret them in relation to market structures.
It is true that a previous reaction at a specific point makes that point interesting, but that does not mean it will produce one again.
Your advanced app is in the Advanced Support and Resistance Mapping for Forex & CFD Traders, where zones, liquidity clustering, and role-reversal help reduce false confidence.
How Levels Become Useful in a Technical Analysis Process
Support and resistance levels become more useful when they are treated as areas of context rather than automatic entry signals. They show where price has previously attracted buying or selling interest and where traders may want to pay closer attention to the next reaction.
When combined with market structure, these zones can help traders plan decisions before entering a position. Instead of assuming that price must reverse at a particular level, traders can use the area to assess what price does next and define where their original trading idea may no longer be valid.
Pillar 4 — Trendlines and Channels: Understanding Direction
The trendline and channel are the graphical analysis tools that help to look at the movement of prices and possible zones of support and resistance.
The efficiency of these techniques lies in the adequacy of their depiction of the price behavior and their correspondence to the market situation.
Nevertheless, the trendline is an artificial tool, and people can draw it differently. The breach of the trendline is not necessarily the end of the trend.
This is the practical approach inside Trendline Trading Explained where slope validity, channels, and confluence matter more than “touch entries.”
When Trendlines Fit the Market Context
While trend lines are useful in analysing directional market movements, horizontal channels can prove helpful in studying range-bound price movements.
The most crucial point to consider is that the selected instrument is capable of correctly depicting the price structure at hand, without forcing the desired pattern upon the price action.
Pillar 5 — Indicators: Tools for Confirmation, Not Prediction
Technical indicators utilize historical and sometimes even current market data for calculations related to trend direction, momentum, and volatility.
Indicators may assist traders in analyzing conditions and developing trading strategies but do not provide any ability to forecast future prices.
The effectiveness of indicators will depend on their interpretation and the market conditions.Moving Averages, RSI
That mindset and a rule-based approach to MA, RSI, and ATR are covered in Technical Indicators Explained
Mastering Indicators: A Noob-Friendly Guide
Indicators are most useful when they support the market context rather than replace it. Each tool should have a clear purpose:
- Moving Averages (MA) can help identify and filter the broader trend direction.
- Relative Strength Index (RSI) can provide context about momentum conditions.
- Average True Range (ATR) can help assess volatility and inform decisions around stop distances and position sizing.
Indicators are most useful when they support a broader analysis of market conditions and risk rather than being treated as standalone signals that guarantee future price movements.
The Step-by-step Process For Technical Analysis
Technical analysis becomes a consistent routine, not a random guess.
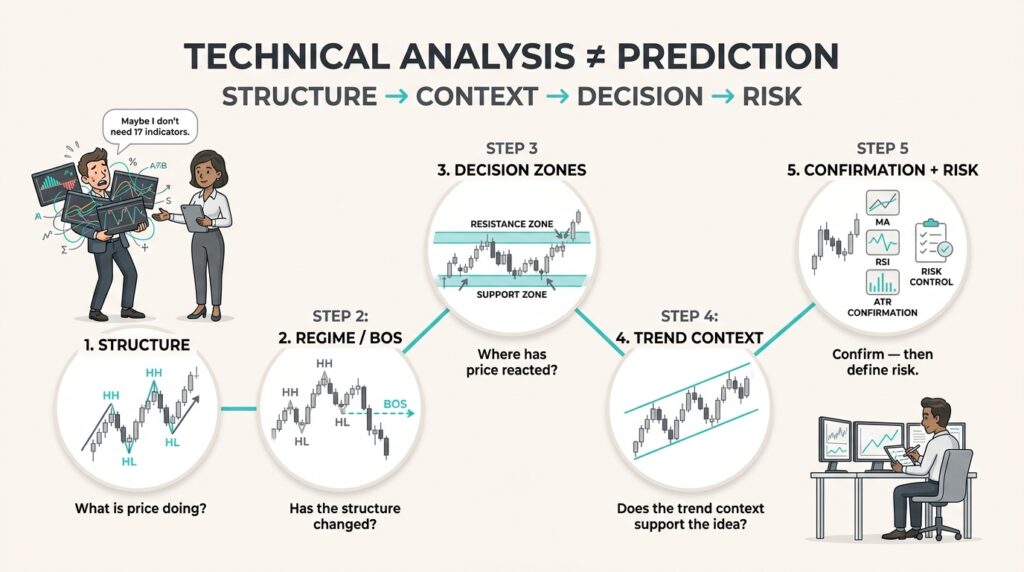
Step 1 — Start With Structure
Determine whether the price is forming a high-high or higher-low pattern. Connect your anchor bias to the main sequence with Market Structure Explained
Step 2: Look Out For Any Signs Of Regime Risk
If BOS appears, treat it as a warning and reassess using Break of Structure & Market Regime Shifts.
Step 3: Chart out teh Decision Zones
Mark higher-time-frame support and resistance zones, along with potential liquidity areas, using Advanced Support and Resistance Mapping for Forex & CFD Traders
Step 4: Incorporate Trend Context Tools
If you’re using trendlines or channels, make sure the chart’s layout is neat, and the market situation backs it up.
Step 5 — Apply Indicators With Rules.
Use MA/RSI/ATR as confirmation and volatility control never as prediction using Technical Indicators Explained
How to Practise Technical Analysis Before Trading Live
Understanding technical analysis becomes much simpler when the trader practices recognizing market structure, labeling support and resistance levels, and analyzing the price action.
Studying charts from the past and demo trading can assist the novice trader in becoming familiar with this approach without risking any money.
But one must keep in mind that this approach cannot fully recreate real trading conditions and emotions. Also, practicing technical analysis does not guarantee future success in trading.
A controlled execution environment is available via the VARIANSE trading account page, where you can practice identifying structure, mapping zones, and applying indicators with rules under realistic market conditions.
Conclusion
Technical analysis is not the search for the ultimate indicator and prediction of all market moves. Technical analysis gives a systematic approach to analyzing price behavior, determining market conditions and formulating trading scenarios.
For a novice trader, the basics are the market structure, possible changes in the market structure, support and resistance, trend lines and indicators.
Using these tools in conjunction with proper risk management will make decision-making better informed. But technical analysis can neither remove uncertainty nor guarantee success.