
Support and resistance are the most commonly talked about technical terms but identifying and interpreting these levels is difficult for novice traders.
In fact, traders use horizontal lines in their charts for identifying levels at which price has reacted in the past. Nevertheless, just because something happened at these price levels before does not mean that price would behave in a similar way going forward.
The advanced technique of support and resistance uses the price zones within the framework of market structure and volatility. It provides an opportunity for traders to evaluate certain levels and take action based on that
What Do Support and Resistance Levels Mean in Trading?
Support and Resistance aren’t technical indicators. They are behavioral footprints left by market participants.
Support refers to a price area where buying interest has previously been sufficient to slow or reverse a decline.
Resistance refers to an area where selling interest has previously slowed or reversed an advance.
These levels are defined through observable behavior of prices, rather than by knowing the intentions of each market participant in placing his orders.
It is possible for support and resistance levels to exist around previous swing high and low levels, areas of consolidation and psychological levels. But past responses cannot predict future responses.
This view aligns with how the Bank for International Settlements describes the flow of money and order in its market microstructure studies
Why Single Lines Fail and Support Resistance Zones Work
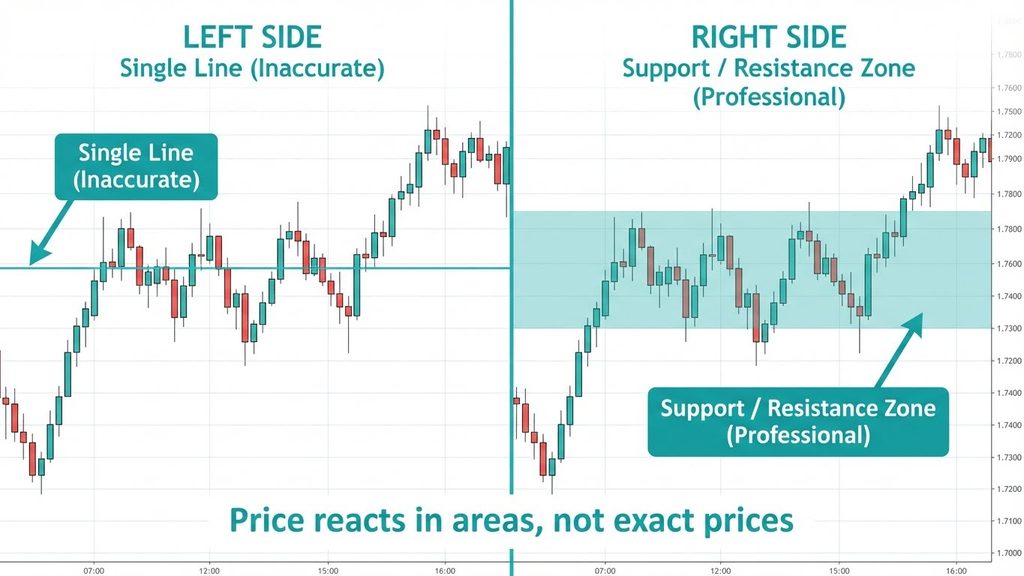
Price Does Not Always React at Exact Levels
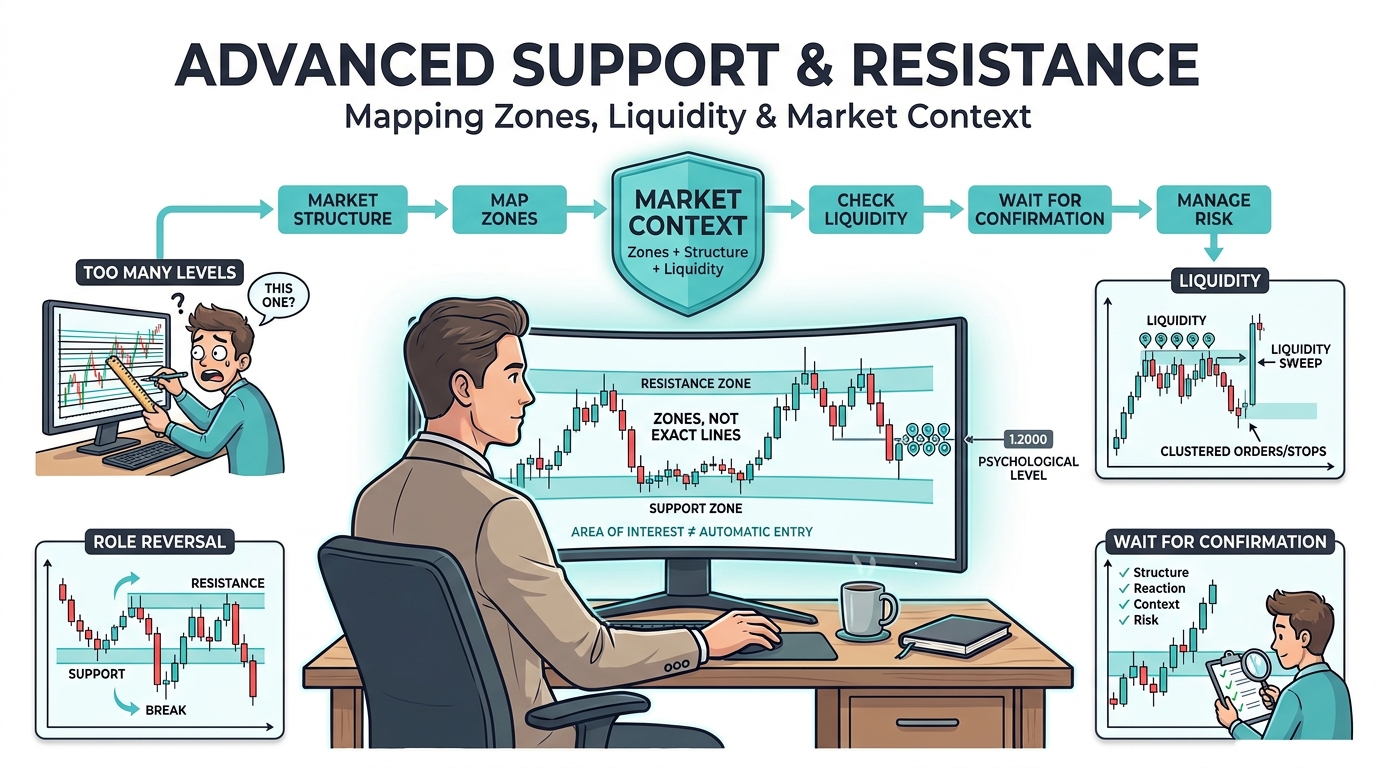
Markets are not precision instruments. Prices rarely react at an exact price level because of spreads, volatility, and order flow. Professional traders, therefore, work with support and resistance zones, not lines.
A high-quality support/resistance zone typically:
- Covers areas where price action levels reacted multiple times
- Accounts for wicks, not just candle bodies
- Allows room for liquidity zones, sweeps, and false breaks.
- This shift alone eliminates many beginner-level execution errors.
Advanced Support and Resistance Mapping Techniques
Professional traders rely more on context than on fixed price levels. These techniques improve both precision and reliability
Multi-Timeframe Confluence
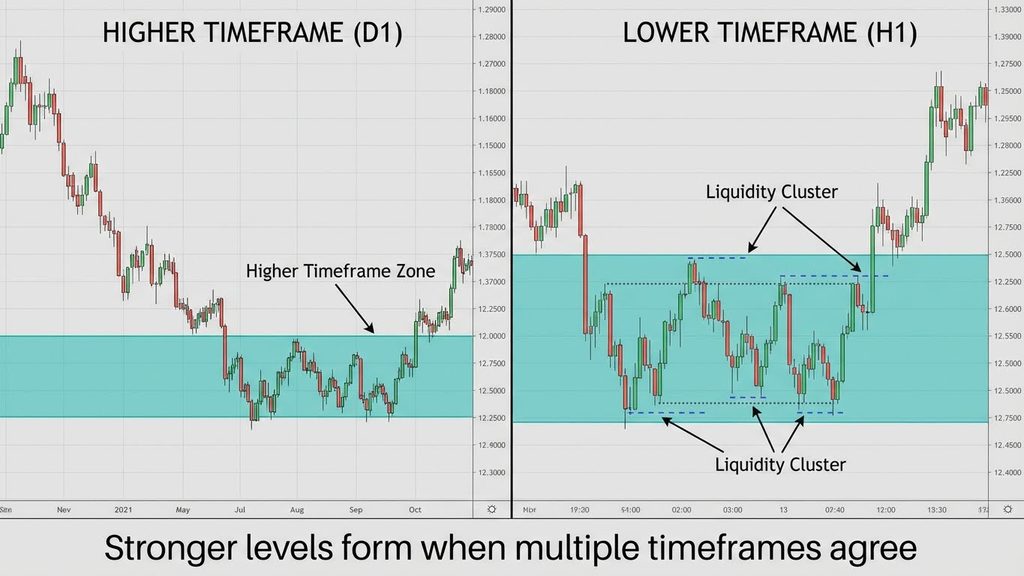
The multi-time frame analysis refers to the process of looking at price action from multiple chart time frames in order to determine the relationship between price action from smaller time frames and the prevailing market environment.
For instance, a price level that acts as a support region on the daily chart could correspond to a major swing low at the four hour time frame.
This may increase the chances that the price level is important to follow but not necessarily a reversal level or an area that is more statistically significant.
This concept is built on the structural principles discussed in Market Structure Explained: HH, HL, LH & LL.
Liquidity-Based Zones
The multi-time frame analysis refers to the process of looking at price action from multiple chart time frames in order to determine the relationship between price action from smaller time frames and the prevailing market environment.
For instance, a price level that acts as a support region on the daily chart could correspond to a major swing low at the four hour time frame.
This may increase the chances that the price level is important to follow but not necessarily a reversal level or an area that is more statistically significant.
Grasping this pattern can cut down on emotional buying and selling, tying in with ideas from the article Break of Structure & Market Regime Shifts
Role Reversal: When Support Becomes Resistance
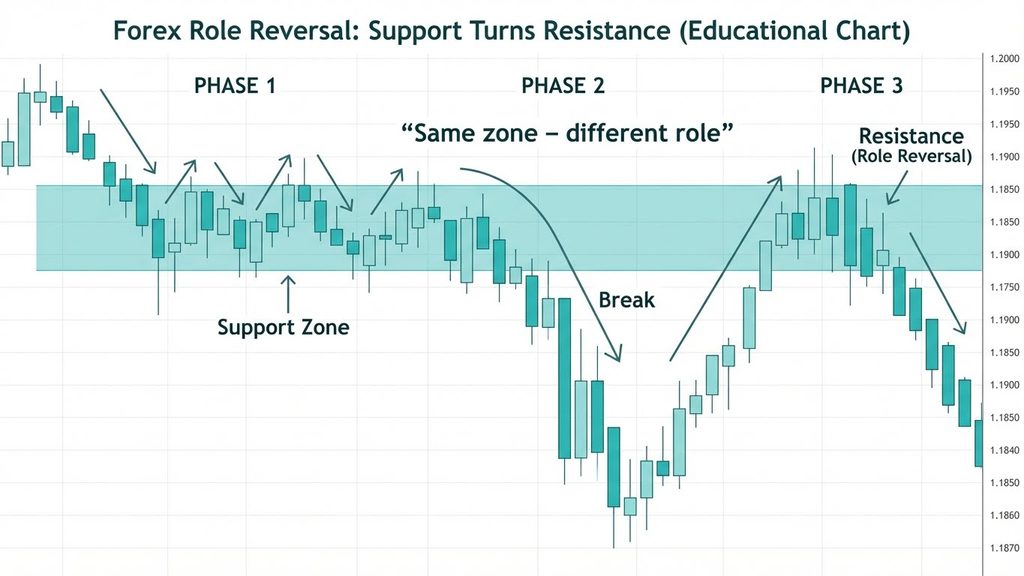
Role Reversal refers to the circumstance whereby the old support turns into resistance once the price falls below that level.
Price could drop through an old support level, bounce up towards that support level but fail to break above it.
In contrast, the other side of the coin is whereby the old resistance level becomes support once the price breaks upwards.
Nonetheless, role reversal may not always follow a breakout since sometimes, the old levels become irrelevant due to changes in market dynamics.
Psychological and Round-Number Price Levels
Round numbers, such as 1.2000 in EUR/USD, can attract attention because they are easy to recognise and remember.
Some market participants may use these prices when setting targets, placing orders or evaluating market movements.
However, the presence of a round number does not establish that a significant volume of orders is concentrated there.
These levels are best considered alongside historical price behaviour and broader market conditions rather than used as standalone trading signals.
Support and Resistance in Market Structure Context
Levels of support and resistance may be examined together with market structure to gain further insight into price movements.
For example, a support zone may develop near a higher low during an upward trend, while resistance may appear near a lower high during a downward trend.
These relationships can help traders identify areas worth monitoring, although they do not guarantee that an existing trend will continue.
A support or resistance level is therefore best viewed as a reference area within the broader market structure, rather than an automatic entry or exit signal.
A level without structure is just a reference point. It turns into a crucial decision moment.t This connection is key to understanding the basics of Market Structure: HH, HL, LH & LL.
Common Support and Resistance Mapping Mistakes
Over-Marking the Chart
Too many price levels may complicate the analysis process. Traders can concentrate on those price levels that are more important, based on their previous responses and market conditions.
Ignoring Higher Timeframes
The higher-timeframe levels may be useful when trying to make short-term decisions. Nevertheless, intraday levels are still useful, depending on the type of trading and time horizon.
Trading Levels Without Confirmation
A support and resistance zone points out to areas that matter rather than areas for making trades. Traders need to evaluate the price behavior around such zones before doing anything else.
These mistakes often cause rash choices and tie in with the problems talked about in Revenge Trading Explained
How Traders Can Use Support and Resistance
Support and Resistance can be used by traders to identify possible reaction points, to assess market conditions and have a benchmark for making trading decisions.
Traders may also combine this tool with other technical approaches such as trend analysis, market structure etc., before taking a position.
However, the importance of any point depends upon market conditions and also on how one approaches trading. Reactions at Support and Resistance points do not always imply profit-making situations.
This way of thinking matches up with what’s talked about in the article Reading Price Clearly Without Overthinking.
Risk Management Around Support and Resistance
The support and resistance zones could serve as reference points for determining whether or not the trading plan becomes invalid.
For instance, traders might look to place a stop loss outside a certain structural level based on their personal strategy.
Nevertheless, the stop loss does not always get executed at the intended price level due to various market factors.
In addition to setting the stop loss, risk management involves proper position size and leverage considerations.
This reduces emotional interference and protects capital, particularly in leveraged CFD trading. You can practice this skill without the pressure of real stakes in a simulated setting through the VARIANSE trading account page.
A Practical Support and Resistance Mapping Workflow
- Identify significant support and resistance zones on the daily and four-hour charts.
- Examine shorter timeframes to understand price behaviour within those zones.
- Note relevant swing highs, swing lows, consolidation areas and round-number levels.
- Consider how each zone relates to the broader market trend.
- Observe price behaviour around the identified areas without assuming a reaction will occur.
- Define potential entry conditions, invalidation levels and risk limits before considering a trade.
- Review trading decisions and refine the mapping process over time.
Conclusion: Understanding Support and Resistance Zonesusion:
Identification of the support and resistance levels is a systematic process of locating price regions where past reactions have happened.
Through the use of such a system together with market structure, multi-timeframe approach and proper risk management, one can gain a better system for doing technical analysis.
But the problem here is that there is no guarantee that support or resistance levels will give you an idea about future price direction. Past reactions may be valuable, but the market can always change.
What is important is that support and resistance are reference regions for analyzing price movement.