
Trendline trading appears straightforward: draw a line, follow the trend, and look for an opportunity.
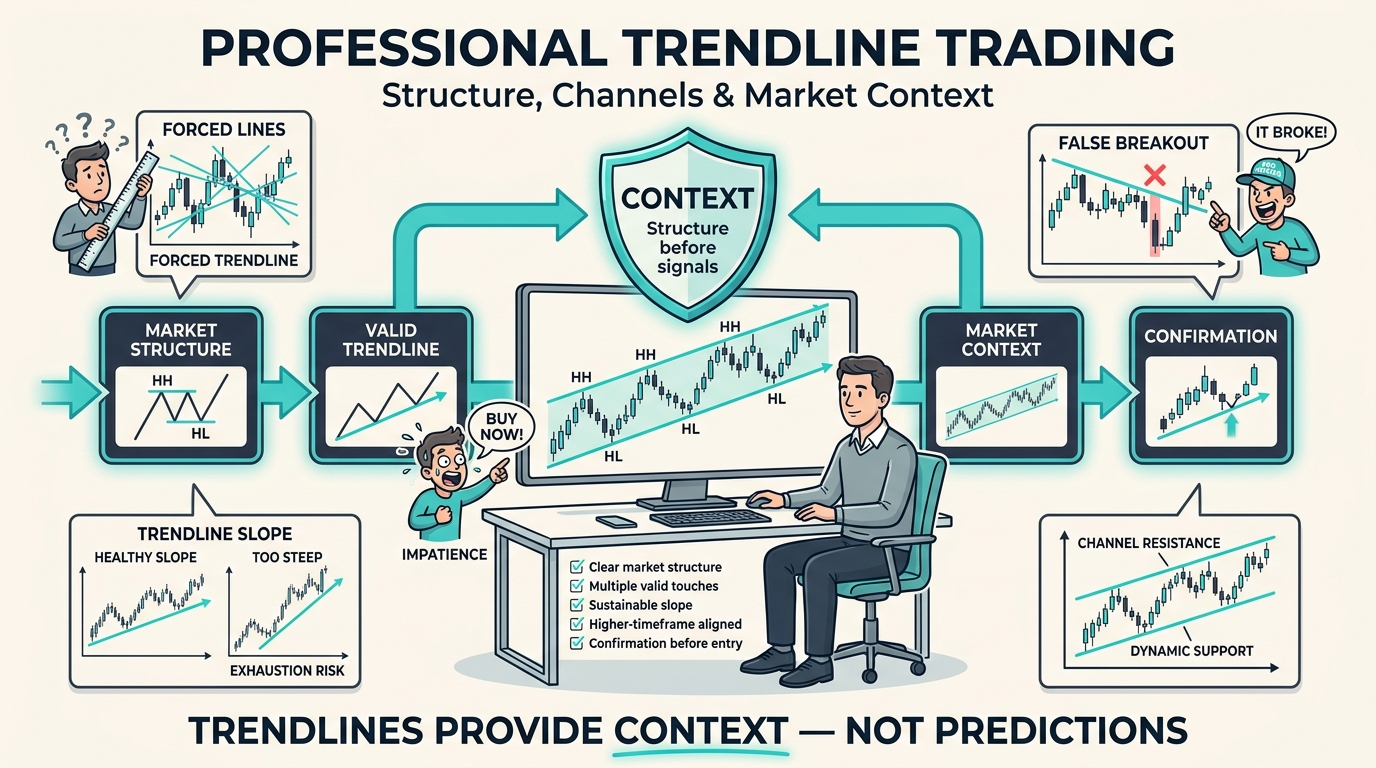
In practice, most traders fail because they treat trendlines as signals rather than contextual tools. Trendlines aren’t forecasting tools. They are market-aligned structural references that only function when they’re in sync with market trends.
For those who trade Forex and CFDs, knowledge of trend lines and trading channels can be helpful to technical analysis through a graphical representation of price movement and changes in behavior in the market.
What Is Trendline Trading and What Is It Not?
In trendline trading, the use of lines that connect important points in order to assess the direction of the market and the zones of price reaction is used.
The upward trendline can be drawn below swing lows when there is an uptrend, whereas the downward trendline is usually drawn above swing highs when there is a downtrend.
However, these trendlines are not necessarily entry or exit signals since they can simply serve as dynamic levels of support or resistance.
The trendline can be interpreted subjectively and different traders may draw different trendlines from the same chart. Even respected trendlines can eventually break depending on new market conditions.
Understanding Market Structure Before Drawing Trendlines
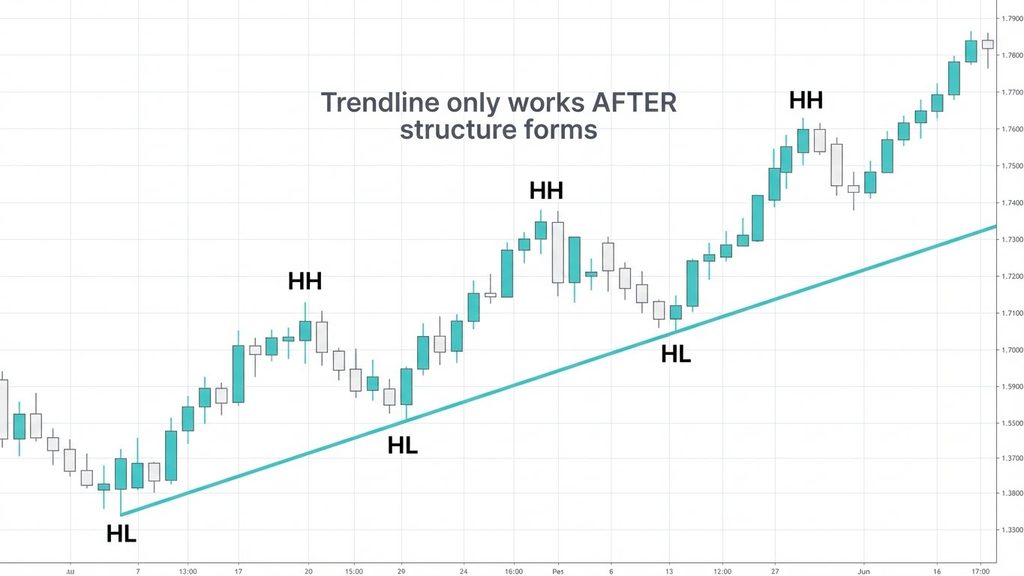
It is important to consider market structure when analysing trendlines, since by looking at successive swing high and lows, one can establish whether there are uptrends, downtrends or range bound movements.
Higher Highs and Higher Lows: Uptrend Structure
A positive trend is often characterized by a series of rising peaks and rising troughs.
An ascending trend line placed below important swing lows could be useful in showing the trend direction and pinpointing possible support levels.
But a trend line touch does not necessarily mean that price will keep rising.
This market structure is detailed in the article: Market Structure Explained: HH, HL, LH & LL.
Lower Highs & Lower Lows (Downtrend Structure)
The declining trend is characterized by successive low-highs and lows.
Drawing the descending trendline above the swing highs may aid in recognizing the trend direction and potential levels of resistance.
Nevertheless, the existence of a declining trend alone cannot serve as a reason to initiate a short position.
Ranging or Transitional Markets
A sideways movement in price, or price that moves up and down often, can make it harder to draw trendlines of directionality.
Traders may find it easier to focus on finding support/resistance lines horizontally or boundaries of a trading range rather than trying to draw a directional trendline.
These situations usually come up after big changes in the market, like what’s talked about in the article Break of Structure & Market Regime Shifts.
Trendline slope, Validity & Common Errors
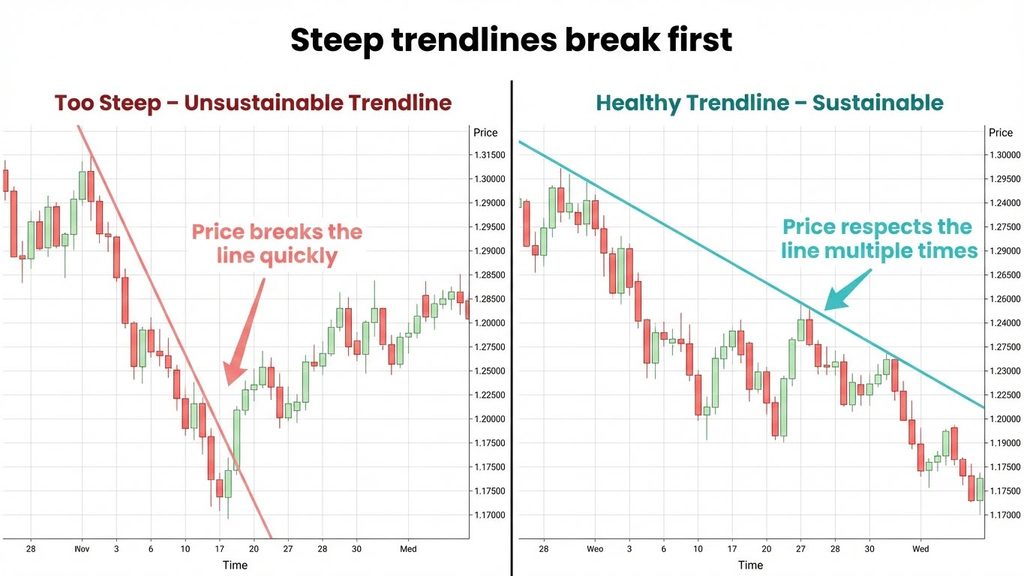
The slope of the trendline represents the pace of price movements over the specified time frame.
A steep trendline can signal fast price movements whereas a gentler trendline can signal slower trends. Nevertheless, slope alone cannot help define if the trend is strong, sustainable or even capable of reversing.
Typically, traders use at least two relevant swing points in drawing the trendline although some interactions can give additional information on how price behaves around the trendline.
The most common mistakes are the following: forcing the trendline through irrelevant price points, continuous redraws to fit the trendline according to personal expectations and neglecting the overall picture of the market.
Trendlines are merely a tool for analysis rather than an inflexible guide for price.
Trend Channels: Understanding Parallel Price Boundaries
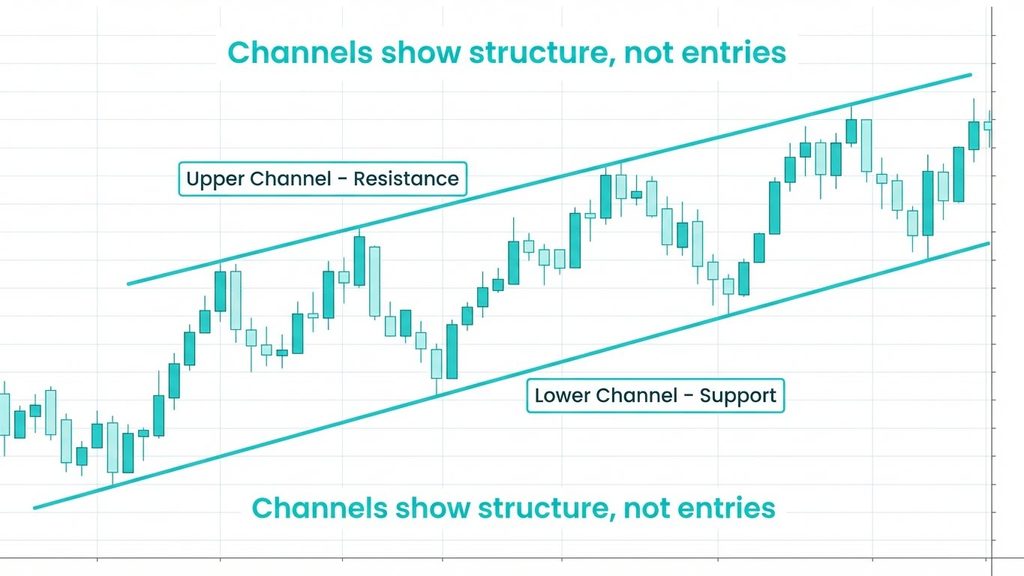
Channel formation involves drawing one major trend line and another similar line on the other side of the price action.
The bottom trend line of an ascending channel will be seen as possible support, while the top trend line will be viewed as possible resistance.
For the descending channel, the top trend line will be seen as possible resistance, while the bottom trend line will be viewed as possible support.
Trends can be used to gauge the range of price movement for a trend. Nevertheless, price movement could breach any of the two lines without a subsequent reversal or breakout.
Market Context: Why Trendlines Need Context
Trendlines can be interpreted alongside broader market conditions to provide a more complete view of price behaviour.
Higher-Timeframe Context
Trendline on a five minute chart may indicate a short term trend which might be different from the trend indicated by the daily chart.
Just because the trend is short term, it does not make the trendline on a five minute chart irrelevant.
Volatility & Market Conditions
Prices could move very quickly in times of high volatility or important economic announcements outside their trend lines.
Nevertheless, low volatility is not a guarantee that trend lines are maintained, nor does it mean that the trend continues.
Trendline Confluence
Trend lines could be overlapped by support and resistance levels, swing highs and lows, and other such technical indicators.
Although such an overlap could turn out to be noteworthy, it does not mean that the price will react to it under all circumstances.
This dynamic-static structure relationship provides deeper insights into Advanced Support and Resistance Mapping for Forex & CFD Traders.
How Traders Can Use Trendlines in Practice
Trend lines can be used by traders to determine the direction of prices, possible support or resistance levels and the sustainability of the prevailing market trend.
There are some strategies that focus on the way prices behave at the trend lines, at the channel borders or after the breakout.
It must be noted, however, that no particular trend line strategy fits all market situations.
The other aspects to be taken into account when trading include proper sizing of the positions, leverage and risks.
Trendline analysis should always be considered alongside an understanding of trading risk. The Commodity Futures Trading Commission (CFTC) provides independent guidance on market risks and investor protection, which can help traders understand why technical analysis alone cannot guarantee successful outcomes.
Why Trendline Trading Can Be Challenging for Beginners
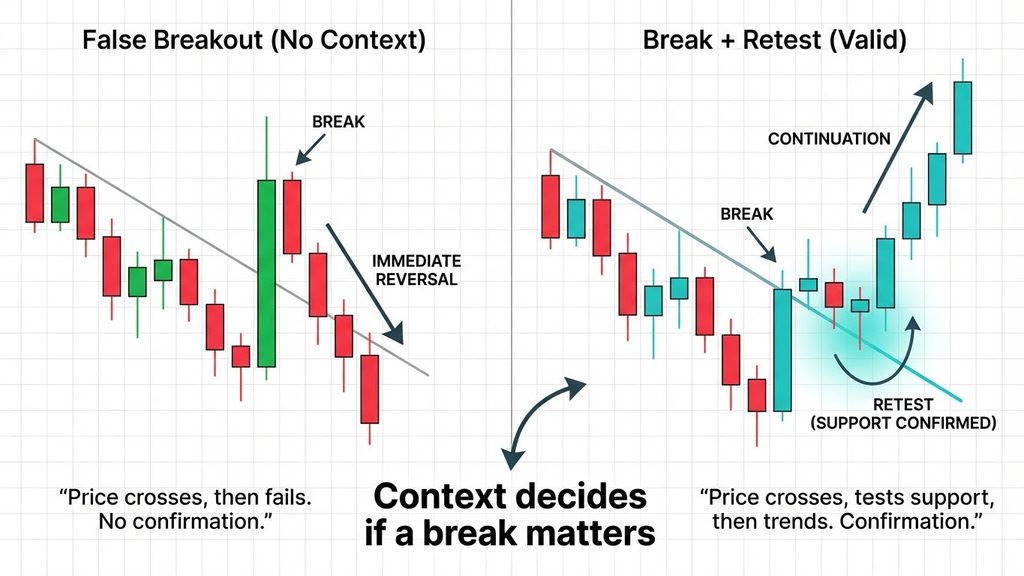
A problem that traders who are just starting out might face is drawing trendlines in an inconsistent manner and ignoring the broader context of the market or assuming that each time a trendline touches the price line represents a setup for a trade.
The other mistake that a trader could make would be that a breakout will necessarily mean the formation of a continuation or reversal pattern.
It could happen because of a false breakout where the price moves above the trendline but reverts back into the previous range or direction.
Even consistent trendlines can provide misleading information at times.
Conclusion: Trendline Trading Is About Context, Not Just Lines
Trendlines offer a framework for gauging the direction of prices, support, and resistance as well as market conditions.
The examination of market structure, trendline inclination, trading channels, and the overall context of the market enables traders to use a systematic approach to technical analysis.
Nevertheless, trendlines are subjective in nature and do not enable traders to predict future price action and reduce risks involved in Forex and CFD trading.