
Trading is rarely destroyed by bad strategies; it is destroyed by uncontrolled equity curve management. A trader might have a system that looks good on paper but still lose an account if market volatility spikes.
That’s why seasoned traders put more effort into keeping their investment graph steady than into just racking up wins. Managing the Equity Curve isn’t about being perfect. It’s all about staying alive. When the Equity Curve is in check, the trading edge gets to unfold kind of like what we’re talking about in What Is a Trading Edge?
What Is an Equity Curve in Trading?
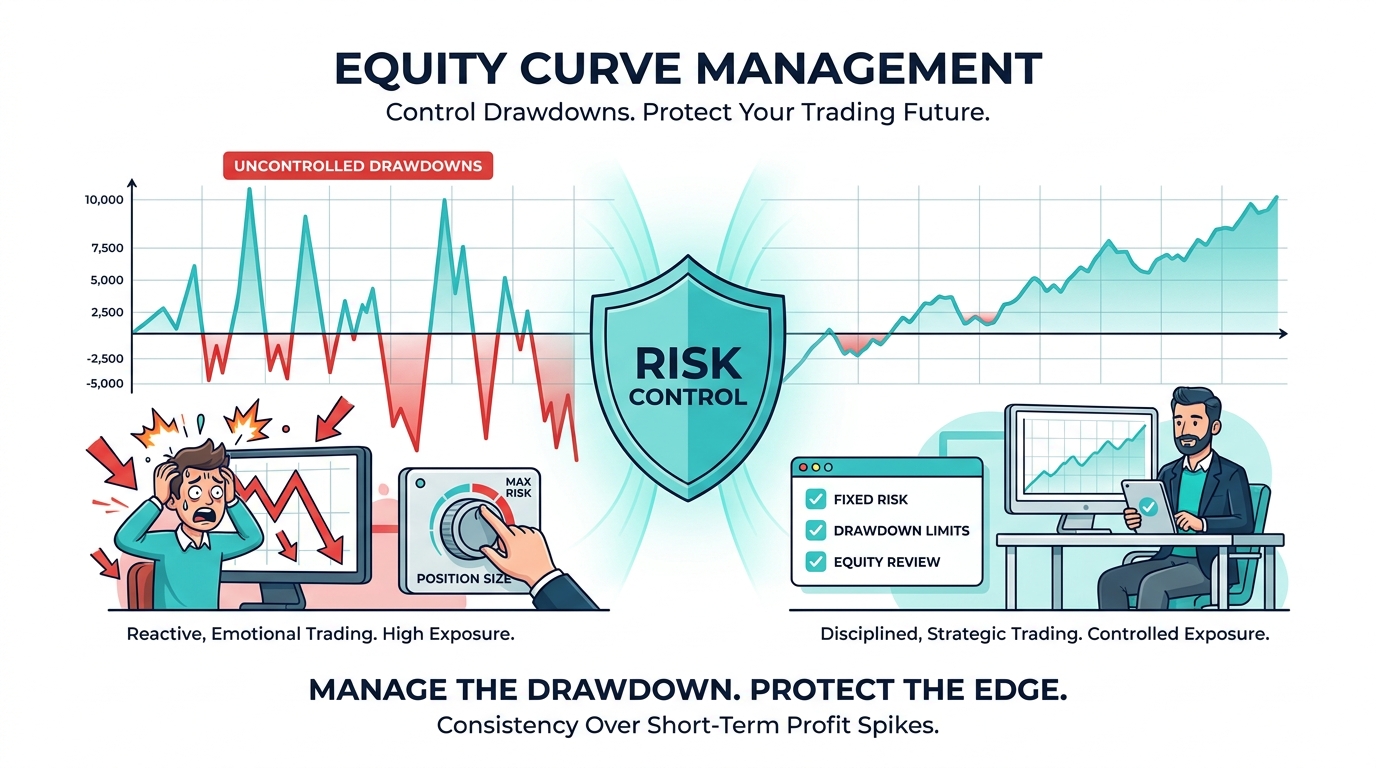
The Equity Curve shows how your account’s worth changes over time, including both profits and drawdowns. The Equity Curve doesn’t just show balance; it also reflects volatility, drawdown depth, and consistency of risk exposure.
Professional traders don’t measure success by just one good month. They judge it by how steady and consistent the curve looks over long periods — the same trading performance mindset we talked about in Trading Performance Explained.
Key takeaway: A steady rise in stock value is more important than quick gains.
Equity Curve vs. Balance Curve — Why Equity Matters More
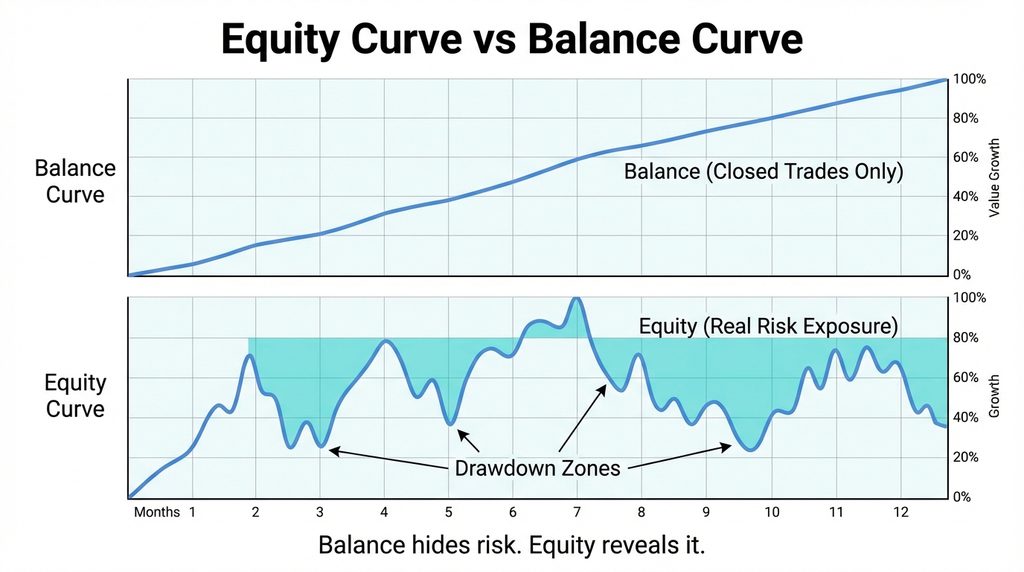
Many beginners focus only on their account balance, which hides important information. Balance shows closed trades.
Equity shows real-time risk exposure and open risk. The Equity Curve shows sneaky overexposure, poor stop placements, and risks piled up in trades- issues that pop up when correlated assets move together unexpectedly, as detailed in the link Correlation & Risk Management.
Types of Equity Curve Patterns Traders Experience
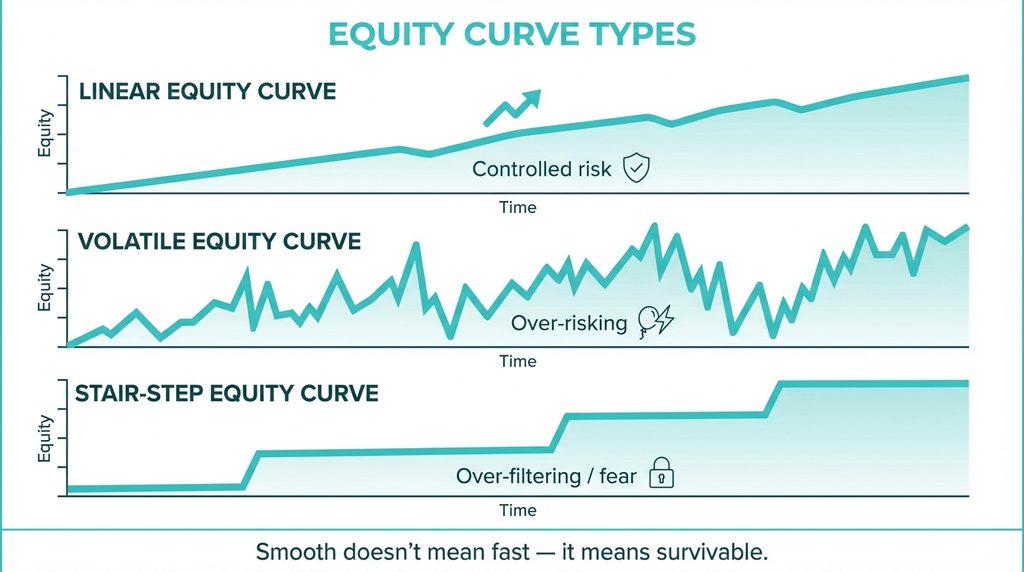
An equity curve shows how a trading account's value changes over time, revealing patterns of growth, losses and drawdowns. Different equity curve patterns can help traders assess strategy performance, risk exposure, and execution consistency.
Understanding these patterns matters because a rising equity curve doesn't always indicate a reliable trading strategy. Traders should also consider volatility, drawdown severity, and whether performance is sustainable as market conditions change.
Linear Equity Curve
Slow and steady growth, careful reductions, and disciplined risk-taking. This pattern often results from rules-based execution similar to the logic described in Discretionary Trading vs Rules-Based Trading.
Volatile Equity Curve
Large performance swings, difficult decision-making, and a higher probability of execution mistakes. This curve pops up a lot when people get their expectancy wrong. Check out the logic discussed in Trading Expectancy Explained.
Stair-Step Equity Curve
Flat periods followed by sudden gains are often caused by inconsistent risk exposure or delayed trade execution.
Key takeaway: Smooth performance means survivability, not speed.
Why Drawdowns Are Normal (And Not Failure)
Even strong trading strategies experience drawdowns. They happen because of statistical variance, market regime shifts, and the random distribution of wins and losses.
The real risk isn’t the drawdown itself; it’s how people respond. Traders sometimes increase their bets during a losing streak, which can accelerate losses. This common error is also discussed in the article Trading Losing Streaks Explained.
Core Equity Curve Management Techniques
Effective equity curve management focuses on controlling risk, limiting drawdowns, and maintaining a disciplined trading approach. Rather than chasing short-term profits, traders use predefined risk limits and position-sizing rules to manage account exposure.
These techniques help traders protect trading capital, reduce unnecessary volatility, and evaluate performance more consistently. However, no risk-management approach can eliminate losses or guarantee steady equity growth.
Fixed Risk Per Trade
Maintaining a small, consistent risk per trade prevents small losses from turning into major drawdowns. Consistency usually outperforms aggressive risk-taking.
Volatility-Based Risk Adjustment
When the market gets more unpredictable, it’s wise to scale back on how much you’re betting. This principle reflects the same robustness logic we talked about in the Backtesting Basics Without Curve Fitting article.
Equity Curve Circuit Breakers
Predefined rules, such as pausing after a certain drawdown or reducing size after consecutive losses, support stronger drawdown control and prevent emotional spiral trading.
Strategy Segmentation
Running strategies independently reduces the risk of overlooking hidden connections. Trading without breaking things down can lead traders to pile on risk, much like overconfidence from too-tight models can mess things up.
Managing an equity curve requires understanding overall portfolio exposure, not simply monitoring individual trades. The U.S. Securities and Exchange Commission's investor education guidance explains how diversification, asset allocation and risk tolerance influence portfolio risk. Although these principles cannot prevent drawdowns, they highlight the importance of evaluating combined exposure and maintaining appropriate risk limits.
Equity Curve Management Vs Strategy Optimization
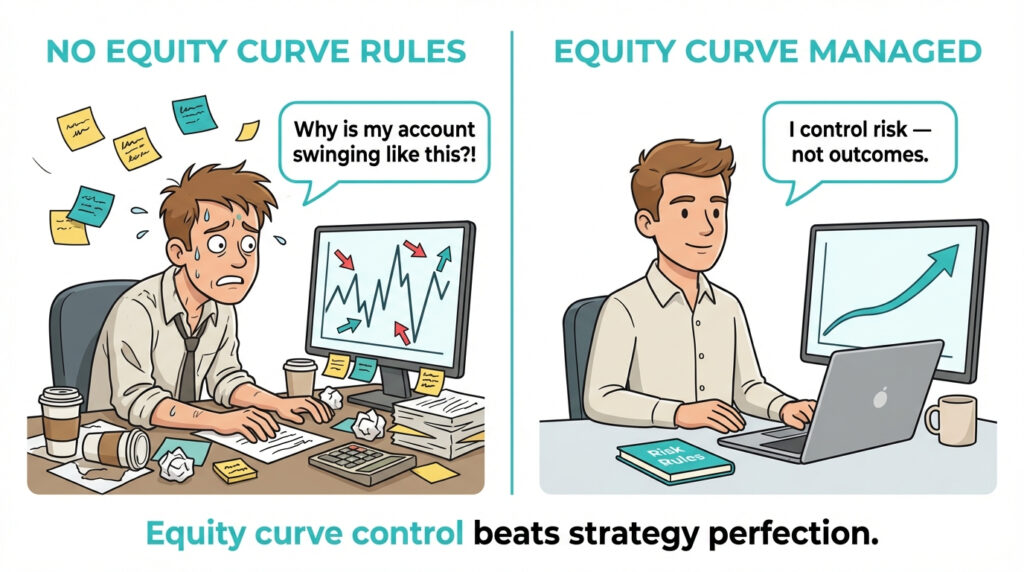
Many traders spend years fine-tuning their entry strategies. Experts fine-tune how they handle risk, manage withdrawals, and plan comebacks.
A strategy that’s just okay but tightly manages the Equity Curve usually beats a flawless one that lacks discipline. It’s obvious when traders get the hang of the probability framework in Trading Expectancy Explained.
Common Equity Curve Mistakes That Kill Accounts
When you’re trying to bounce back after a loss, you might keep chasing trades, not pay attention to how things are connected, focus too much on one trade, and keep going even when you’re tired — all of this can mess up equity curve trading behavior.
These slip-ups often come from the mental cracks we don’t see, as explained in the Psychology of Trading.
How Professionals Use Equity Curve Rules
Professional trading desks enforce maximum drawdown limits, mandatory cooling-off periods, and structured risk-reduction phases.
Traders are judged more on the steadiness of their equity curve than on one-off wins. This approach focuses on consistency, like in the book Trading Performance Explained.
Practical Equity Curve Management Rules for Retail Traders
Effective equity curve management begins with clear, practical rules that help retail traders control risk and respond to losses without making emotional decisions. Instead of focusing solely on growing account balances, traders should set limits for position sizing, drawdowns, and trading activity.
A structured approach can help preserve trading capital, reduce impulsive decisions, and maintain consistency as market conditions change. These rules should reflect each trader's risk tolerance, account size, and trading strategy.
Start with a simple structure:
- Keep your trade risk to just 1% each time
- Take a breather after a long string of losses
- Cut down during drawdowns to improve drawdown control
Check your equity curve weekly, not just based on how you feel after each one. When you replace reactions with structure, you'll see that reactions hurt the equity curve the most.
Conclusion: A Smooth Equity Curve Is the Real Edge
An Equity Curve isn’t just a graph; it reflects the overall health of a trading account. Traders cannot control market outcomes, but they can control risk exposure and behavioral discipline.
Traders who last long enough to succeed share one trait: they manage equity before chasing profit. When they control equity, the statistical edge eventually surfaces.