
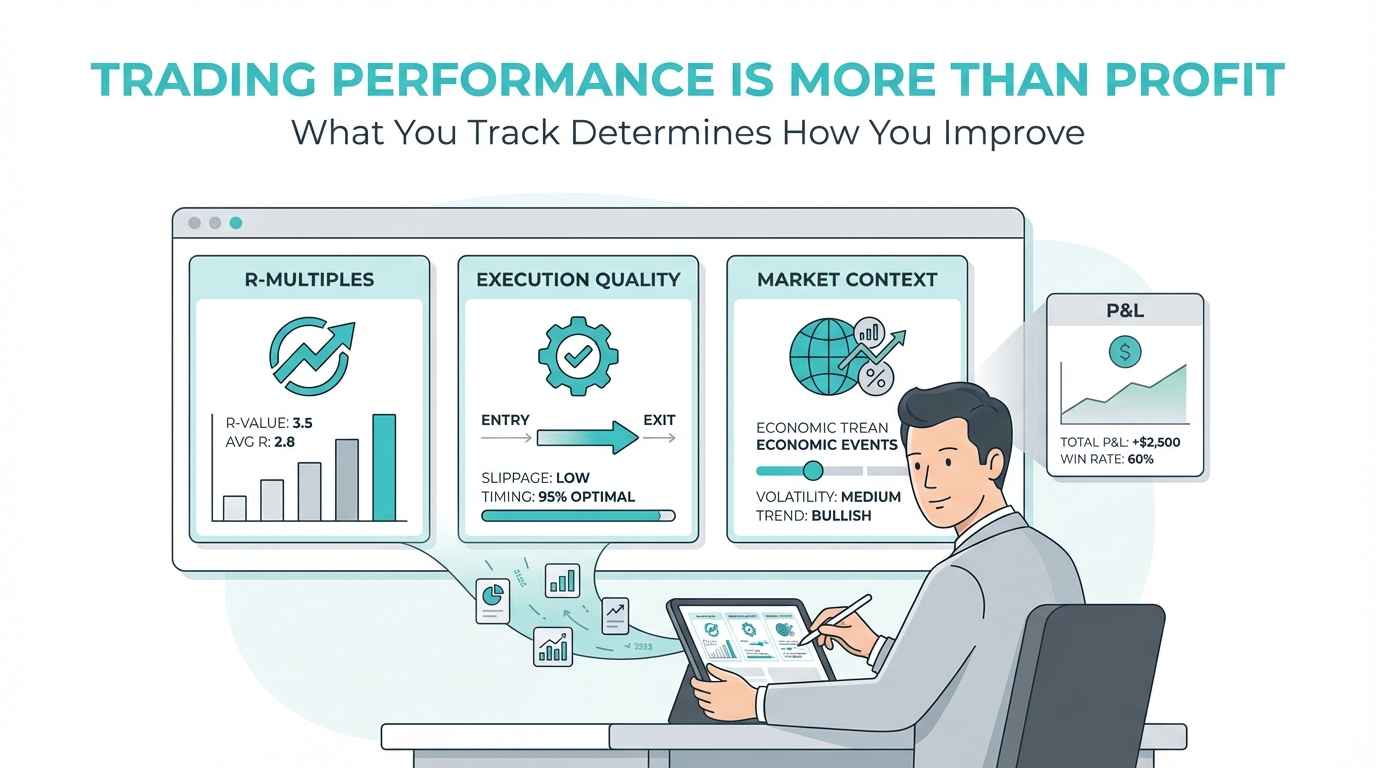
Frequent trading does not always equate to better trading performance. It is equally essential to understand how decisions are made, how risks are managed, and how the strategy performed under certain market conditions as compared to the frequency of trades placed.
While many traders concentrate solely on the profit and loss statement (P&L), this does not provide an insight into how consistent the implementation of the strategy was and what risks were incurred.
Two traders might achieve the same results in terms of profitability while bearing vastly different degrees of risk.
When evaluating trading performance, one needs to go beyond P&L figures and analyze the R-multiples, the trading expectancy, and other aspects.
This lesson will discuss what metrics need to be considered when evaluating trading performance and how performance reviews may affect the decisions made.
Why Trading Performance Is More Than Profit
Profit and trading performance are related, but they are not identical.
However, there can be profitable weeks that involve inconsistent position sizes, violations of the rules or very risky exposure to the market.
On the other hand, there can also be losing weeks with proper trades and risk within the defined parameters. The point here is that an outcome is not always indicative of the soundness of the decision-making involved.
An effective performance evaluation takes into account not only the result, but also the execution and the entire trading process. A profitable trade does not necessarily mean a good execution, while a losing trade does not have to be a bad one.
Why P&L Alone Is Not Enough to Measure Trading Performance
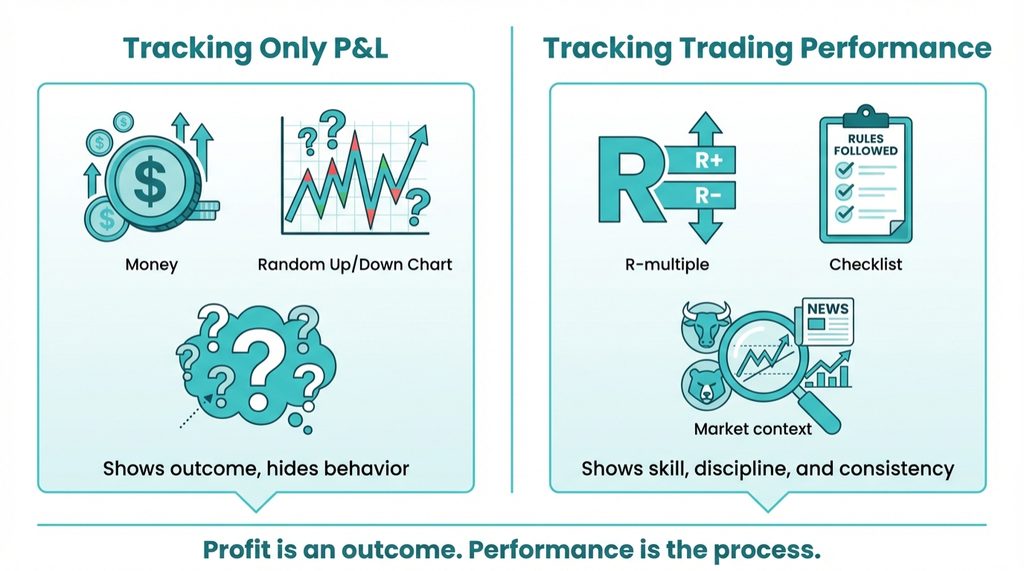
P&L is the term that describes monetary profits and losses that arise from trading activities.
While it is important to measure the financial performance of an organization, it does not necessarily reflect the efficiency of risk management.
For example, a £500 profit may represent a relatively small return on a large amount of risk or a substantial return on a smaller amount.
Trading results may also depend on position size, market volatility, cost of transactions, and other variables.
To make a more comprehensive assessment, traders can include P&L along with measures like R-multiples, drawdown, trading expectancy, and rules following.
This will help to get different angles on the relation between trading, risk, and results.
R-Multiple: Measuring Trading Results Relative to Risk
An R-multiple is the measurement of how the trade has performed in relation to the risk taken initially. It enables traders to evaluate their performance regardless of the amount of risk money.
What Does 1R Mean?
Suppose a trader initially plans to risk £100.
- +2R: A profit of £200.
- +1R: A profit of £100.
- −1R: A loss of £100.
- −0.5R: A loss of £50.
These examples exclude trading costs.
R-Multiple Formula
R-Multiple = Net Trade Profit or Loss ÷ Initial Planned Risk
For example, if a trade produces a net profit of £150 with an initial planned risk of £100:
£150 ÷ £100 = +1.5R
R-multiples make it easier to compare outcomes relative to initial risk, but they do not independently measure account-level risk or prove trading skill.
For a detailed explanation, read R-Multiple Trading Explained.
Why R-multiple Matters
R-multiples may be useful for traders who wish to gauge the average size of their profitable and non-profitable trades.
For instance, a system that succeeds 40 percent of the time may still be able to yield positive expectancy if the size of an average profitable trade is significantly greater than that of an average non-profitable one.
Nevertheless, a higher R-multiple does not necessarily guarantee greater safety of a particular trading strategy.
What Good Trading Performance Actually Looks Like
Good trading performance cannot be defined by a single metric. A more complete evaluation considers several measures together.
Trading Expectancy
Expectancy estimates the average outcome per trade based on historical winning and losing results.
Expectancy = (Win Rate × Average Win) − (Loss Rate × Average Loss)
For example, suppose a strategy has:
- A 40% win rate
- An average winning trade of +2R
- An average losing trade of −1R
Its historical expectancy would be:
(0.40 × 2R) − (0.60 × 1R) = +0.2R per trade
This indicates a positive average result in the observed sample, assuming trading costs are included consistently. It does not guarantee future profitability.
Maximum Drawdown
Maximum drawdown measures the largest observed decline from a previous equity peak to a subsequent trough.
It helps traders understand the severity of historical losses.
Win Rate and Average Win-to-Loss Ratio
Win rate shows how frequently trades are profitable.
The average win-to-loss ratio compares the average size of profitable and losing trades.
Both measures should be evaluated together rather than in isolation.
Execution Consistency
Rule adherence helps traders assess whether entries, exits and position sizes followed the predefined strategy.
Sample Size
A small number of trades may not provide reliable evidence about a strategy's long-term performance.
The number of observations needed depends on the variability of results and the conclusions being drawn.
Trading performance should also be evaluated in the context of the risks associated with leveraged products. The UK's Financial Conduct Authority (FCA) provides information about contracts for difference (CFDs), including the potential for leverage to amplify losses. These risks highlight why traders should assess drawdown and account exposure alongside profitability.
Tracking Trading Mistakes: Separating Losses From Execution Errors
Each bad deal does not indicate a failure, while each good deal is not always an example of a good decision-making process.
A trading journal needs to separate the financial result from the execution process. For example:
- Valid strategy loss: The trader followed the predefined rules, but the position closed at a loss.
- Execution mistake: An incorrect order, position size or other operational error affected the trade.
- Rule violation: The trader entered, adjusted or exited a position outside the trading plan.
- Emotion-influenced decision: Fear, frustration or overconfidence influenced a trading decision.
Recording these distinctions can help traders identify whether performance problems arise from the strategy, its execution or both.
This connects with the behavioural principles discussed in Trading Psychology Explained and Revenge Trading Explained.
Tracking mistakes does not automatically prevent them, but it provides a basis for reviewing recurring behaviours and evaluating possible improvements.
Tracking Market Context: Why Strategies Perform Differently
Various trading methods may deliver varying performance levels due to changing market environments.
For instance, a trend trading method may work differently in an environment with strong trends and in a tight range bound market. Recording market context can help traders investigate these differences.
Market Conditions to Track
- Market structure: Trending, ranging or transitioning conditions.
- Volatility: Relatively high or low price fluctuations.
- Economic events: Scheduled announcements that may influence market activity.
- Trading session: Asian, London or New York trading hours.
- Market sentiment: Relevant risk-on or risk-off conditions.
It is possible that reviewing the above factors in relation to the results of the trade could help the trader spot scenarios where his/her strategies have worked differently in the past.
Nevertheless, any observations made on a small data set cannot be taken as predictions.
Context awareness goes hand in hand with the Economic Calendar Trading and Risk On Risk Off Explained.
The Trading Performance Feedback Loop
A structured review process can help traders connect their trading decisions with measurable outcomes.
A Six-Step Performance Review Process
- Define risk before entry: Establish position size, initial planned risk and exit conditions.
- Execute the trading plan: Record whether entries, adjustments and exits follow predefined rules.
- Document the outcome: Record P&L, R-multiple, execution mistakes and relevant market conditions.
- Review the results: Evaluate performance over a suitable period using both quantitative and qualitative information.
- Identify possible improvements: Look for recurring issues and consider testing specific changes where appropriate.
- Monitor subsequent results: Evaluate whether those changes affect execution quality or trading outcomes.
Where it can be done, testing one variable at a time will make interpretation easier. Such an approach conforms to the tenets of keeping a trading journal and performance reviews. But the feedback loop is simply an evaluation model, not a certainty of better profits.
Common Trading Performance Tracking Mistakes
- Focusing only on win rate: A high win rate does not necessarily indicate positive expectancy.
- Ignoring drawdown: Profitable results may still involve substantial periods of financial loss.
- Overlooking execution mistakes: Strategy outcomes and rule violations should be assessed separately.
- Ignoring trading costs: Spreads, commissions and financing charges can materially affect net results.
- Using inconsistent risk measurements: Changing how R-multiples or other metrics are calculated makes comparisons less reliable.
- Evaluating too few trades: Small samples may produce misleading impressions of strategy performance.
- Changing too many variables simultaneously: Multiple adjustments can make it difficult to identify which changes influenced the results.
- Interpreting results emotionally: Reviewing data objectively helps reduce the influence of individual wins and losses.
The goal is to build a consistent evaluation process that considers both trading outcomes and the decisions behind them.
How Trading Performance Metrics Fit Into a Trading Journal
A trading journal provides a practical way to record and review performance metrics.
For each completed trade, traders can document:
- Initial planned risk
- Net profit or loss
- Realised R-multiple
- Entry and exit reasoning
- Execution mistakes or rule violations
- Relevant market conditions
- Position management decisions
Such data can then be analyzed on a regular basis to uncover any repeated patterns.
For instance, a trader might find out that their mean R-multiple varies depending on market conditions or that constant stop-loss changes impact their realized performance.
Exit strategies are especially significant in this regard as they determine both the realized P&L and R-multiple performance.
Execution discipline also connects directly with Exit Trading Strategies Explained because exit quality strongly affects average R
Conclusion: Trading Performance Requires More Than Profit
The process of assessing the effectiveness of trading performance cannot be reduced only to calculating the amount of profit earned from the trading strategy.
The R-multiple, trading expectancy, drawdown, quality of execution and market conditions can each give useful data about trading performance and the risks assumed.
Using this information in conjunction with the periodic review of the trading journal can help traders to have a better grasp of their actions and find the parts which might need additional analysis.
Yet, none of the above metrics will ensure future success and reduce the risks of trading.