
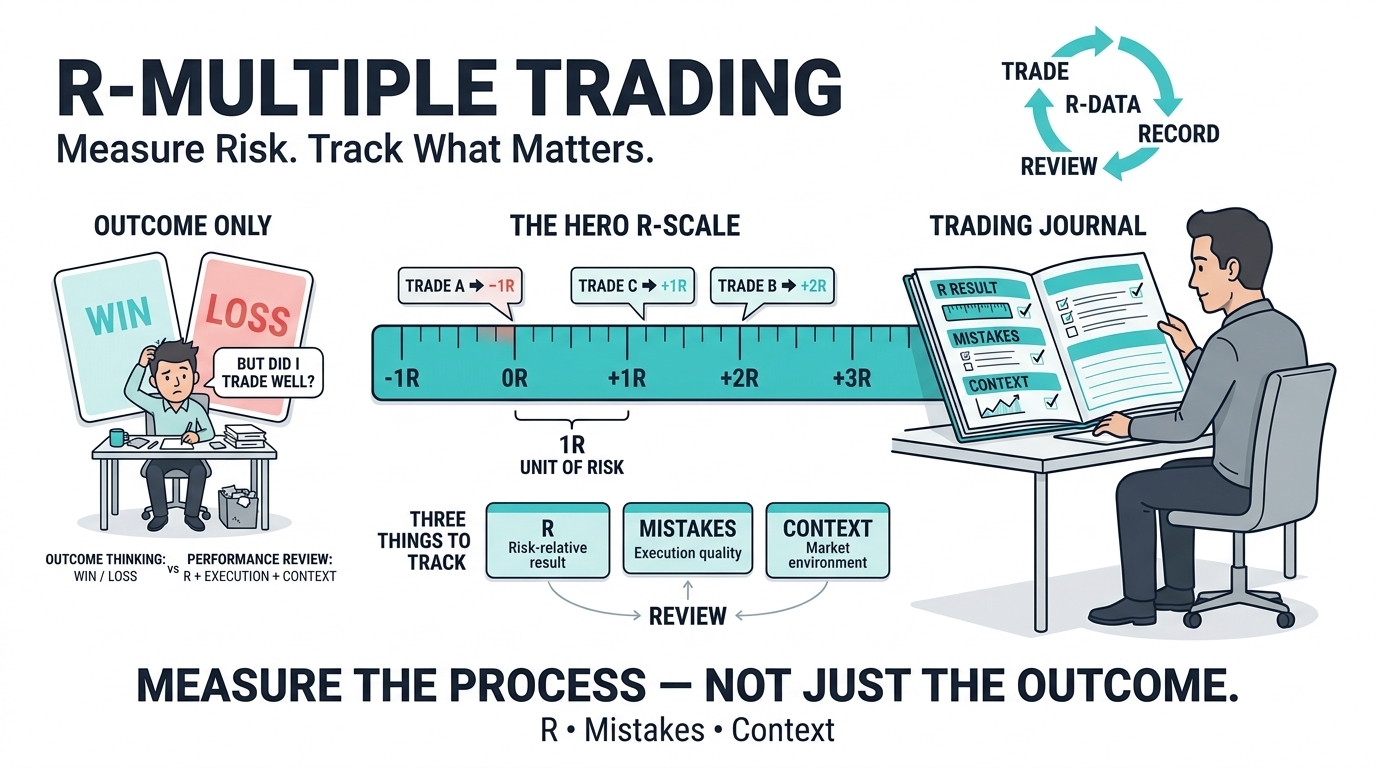
Recording winning and losing trades is only one part of maintaining a trading journal. To evaluate performance more effectively, traders also need to understand how much risk they took, whether they followed their trading plan and what influenced their decisions.
This is where R multiple trading becomes useful.
R-multiples enable traders to compare their trading performances through measurement of the trading performance against the risk that is involved in the initial position taken.
Performance figures alone will not provide an understanding of why a particular trade succeeded or failed. More detailed trading journals include R-multiples together with execution errors and market conditions.
This article provides you with information on how to document such details and use R-multiples in evaluating your performance.
What Is R-Multiple Trading and Why Does It Matter?
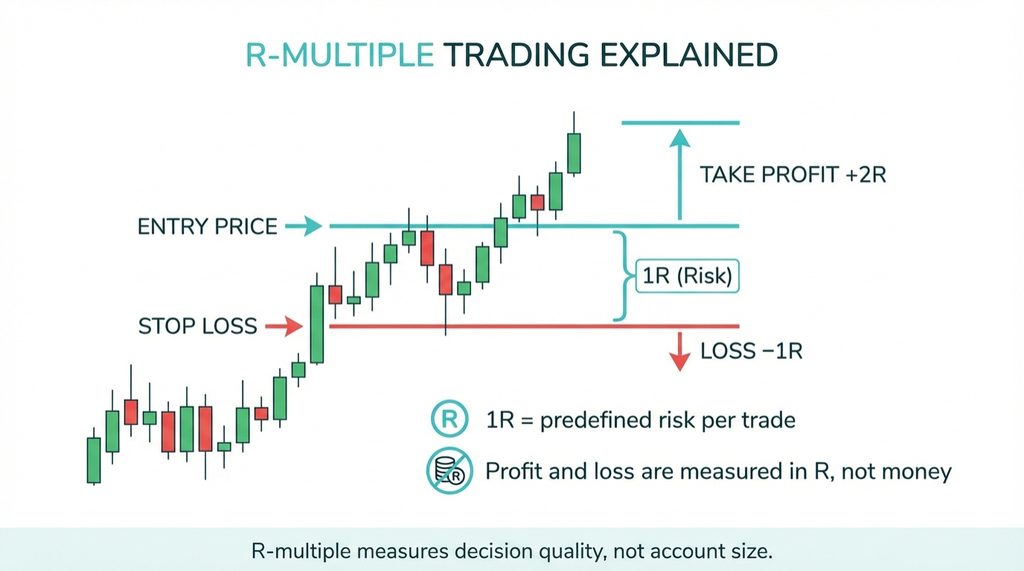
An R-multiple measures the profit or loss of a trade relative to the amount initially risked. Letter ‘R’ is an indication of the risk at the beginning of the trade, and is usually calculated by the difference between the starting price of the trade and the stop loss level at the beginning.
What Does 1R Mean in Trading?
Suppose a trader plans to risk £100 on a position.
- +2R: A £200 profit.
- +1R: A £100 profit.
- −1R: A £100 loss.
- −0.5R: A £50 loss.
These examples exclude trading costs and assume the planned risk is £100.
R-Multiple Formula
For example:
£150 profit ÷ £100 initial risk = +1.5R
£100 loss ÷ £100 initial risk = −1R
Unlike monetary results, R-multiples express performance in relation to the initial risk taken.
This makes it easy to use for comparison between trades of differing magnitudes. Nonetheless, monetary gain and losses are important in assessing account performance and risks. Before entering a position, traders should establish their planned risk using the principles explained in Risk Management Fundamentals.
Why R-Multiple Trading Reveals Real Skill
Two traders may generate the same monetary profit while taking different levels of risk. Consider two hypothetical traders who each earn £1,000.
Example
Trader A
- Initial planned risk per trade: £100
- Total net profit: £1,000
- Result: +10R
Trader B
- Initial planned risk per trade: £500
- Total net profit: £1,000
- Result: +2R
Trader A generated a larger return relative to the stated risk unit. However, this comparison does not establish which trader is more skilled or which approach is safer.
In order to evaluate their performance in an adequate manner, further information is required, which includes information such as account size, risk per trade, number of trades, drawdown, and trading costs.
R-Multiples, Drawdowns and Risk of Ruin
R-multiple tracking will be helpful for traders to know the magnitude and frequency of losses incurred in comparison to the originally intended risks.
Nonetheless, it is vital to make a distinction between risk measurement and risk management.
Managing risk is particularly important when trading leveraged products such as CFDs. The UK's Financial Conduct Authority (FCA) explains the risks associated with contracts for difference, including how leverage can amplify losses. While R-multiple tracking helps traders measure performance relative to initial planned risk, it does not eliminate market risk or guarantee protection against losses.
How R-Multiples Support Risk Analysis
Recording R-multiples can help traders:
- Identify sequences of losing trades.
- Measure average gains and losses relative to initial risk.
- Estimate historical trading expectancy.
- Compare performance across different setups.
- Examine drawdowns expressed in risk units.
Why Percentage Risk Still Matters
Suppose two traders each experience five consecutive losses of −1R.
Trader A initially risks 1% of account equity per trade.
Trader B initially risks 5% of account equity per trade.
Although both record −5R, their financial exposure is substantially different.
If every trader adjusts his/her position size according to the same percentage of remaining equity, the total loss made by Trader A will be about 4.9%, whereas that of Trader B will be around 22.6%.
Understanding Risk of Ruin
Risk of ruin is defined as the probability of losing a sufficient amount of trading capital to meet a certain failure level.
It is influenced by elements such as size of position taken, expectancy of strategy, degree of variability, and order of wins and losses.
Past R-multiples can be useful for risk of ruin analysis, but they cannot alone prevent big losses.
For leveraged Forex and CFD trading, there is a possibility of incurring greater losses than the risk set aside through the stop loss feature.
What to Track First: R-Multiple Per Trade
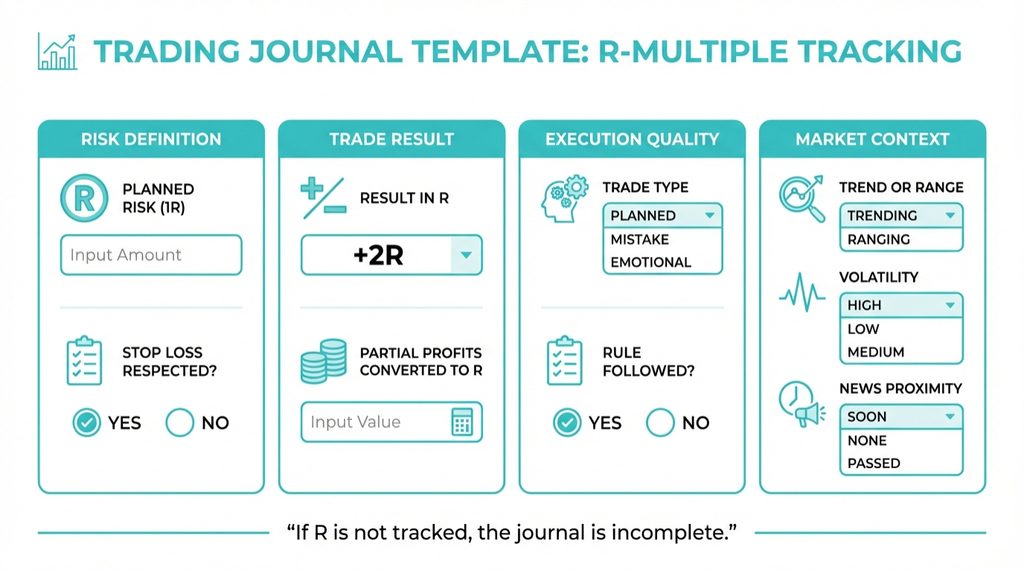
Recording the R-multiple for each closed trade offers a method for comparing results according to the original intended risk level.
Essential R-Multiple Data
For each trade, record:
- Initial planned risk (1R): The monetary amount at risk when the trade was opened.
- Actual net result: The final profit or loss, including applicable trading costs.
- Realised R-multiple: The net result divided by initial planned risk.
- Stop-loss execution: Whether the stop-loss was followed, adjusted or executed at a different price.
- Profit-taking decisions: Whether exits followed the original trading plan.
- Position adjustments: Any changes to position size, stop-loss levels or profit targets.
Example
A trader initially risks £100.
The position closes with a net profit of £180.
Realised R = £180 ÷ £100 = +1.8R
If the same position closes with a net loss of £120, the result is −1.2R.
An outcome below −1R can occur when realised losses exceed initial planned risk, including through slippage or trading costs. This connects with Moving Stop Losses, which explains how stop-loss adjustments can affect trade management and risk exposure.
Tracking Trading Mistakes: Execution Errors vs Strategy Outcomes
Not all losing trades are necessarily examples of bad execution, nor are all profitable trades examples of good decisions.
The trading journal should be able to differentiate between how good the decision is versus how profitable it was.
Four Useful Trade Categories
- Planned and correctly executed: The trader followed the strategy, regardless of whether the trade was profitable.
- Execution error: The trade involved an operational mistake, such as incorrect position sizing or order placement.
- Rule violation: The trader knowingly deviated from predefined trading rules.
- Emotion-influenced decision: Fear, frustration or overconfidence influenced an entry, adjustment or exit.
Why This Matters
In cases where a losing trade has been made in accordance with the trading plan, this could very well fall within the expected probability distribution of that particular strategy.
On the other hand, in the case of a successful trade being conducted without a trading plan, this may actually strengthen the trader’s risky behavior.
This behavioral layer ties in closely with Trading Psychology Explained and Revenge Trading Explained.
Why Market Context Matters When Tracking R-Multiples
The R multiple indicates what happened in the transaction compared to the risk taken at the beginning, but it does not provide any information on the environment in which this took place.
By writing down the trading environment, traders will be able to examine if certain setups perform differently depending on their trading environment.
Market Conditions to Record
- Market structure: Trending, ranging or transitioning conditions.
- Economic announcements: Proximity to scheduled high-impact data releases.
- Volatility: Whether price fluctuations were relatively high or low.
- Trading session: Asian, London or New York trading hours.
- Broader market sentiment: Relevant risk-on or risk-off conditions.
For instance, a break out strategy might result in different historical results during extremely volatile days relative to calmer trading days.
These differences ought to be assessed through a sufficient sample size and not on just a few deals made. For further context, explore Economic Calendar Trading and Risk-On vs Risk-Off Market Environments.
How R-Multiple Trading Helps Measure Expectancy
Trading Expectancy is the average expectation of how a particular strategy will perform in the market, taking into consideration the likelihood of its success and the average profit or loss from trades.
This may be calculated in monetary terms, percentages or R-multiples.
Trading Expectancy Formula
Expectancy = (Win Rate × Average Win) − (Loss Rate × Average Loss)
When average wins and losses are expressed in R, expectancy is also measured in R per trade.
Example
Suppose a trading strategy has:
- Win rate: 40%
- Loss rate: 60%
- Average winning trade: +2R
- Average losing trade: −1R
Using the magnitude of the average loss:
Expectancy = (0.40 × 2R) − (0.60 × 1R)
Expectancy = +0.2R per trade
This indicates a positive historical expectancy of 0.2R per transaction for our sample, on the basis that our figures have been consistently calculated, and take into account any associated trading costs.
But a positive historical expectancy does not mean profits in the future. The results can be different due to market conditions, trade execution, costs, and statistical uncertainty.
How Partial Exits Affect Expectancy
Exiting out of a trade may affect the realized average R-multiple of winning and losing trades.
Therefore, it is prudent for traders to calculate the total result of partial exits when determining the R-multiple for the position. Learn more in Partial Profit Strategy.
Weekly and Monthly Reviews Using R-Multiple Data
Trade records provide valuable data, but analysis of such trade records allows traders to recognize trends and make judgments about their decisions.
Such analysis could be incorporated into the review process, alongside the R-Multiples.
Weekly Review Questions
- What was the average R-multiple per trade?
- Which trades produced the largest losses relative to initial risk?
- Were trading rules followed consistently?
- Did any recurring execution mistakes appear?
- Did specific market conditions influence the results?
Monthly Review Questions
- How has average R per trade changed?
- What is the estimated historical expectancy?
- Have drawdowns increased or decreased?
- Are rule violations becoming more or less frequent?
- Is there enough data to evaluate individual trading setups?
The brief review period might lack sufficient observations to make accurate deductions on the performance of the strategy. This review discipline mirrors the structured evaluation discussed in Exit Trading Strategies Explained.
How Experienced Traders Use R-Multiples
Some experienced traders use R-multiples as an indicator of how their trades performed compared to the original risk plan.
However, R-multiples are just one element of performance assessment.
Depending on the trading approach, additional measures may include:
- Risk-adjusted returns
- Maximum drawdown
- Position-level and portfolio-level exposure
- Trading expectancy
- Volatility of returns
- Rule adherence and execution quality
For institutional trading houses, risk management systems could be quite elaborate, with portfolio limits, stress testing, and liquidity analysis being among some of the measures used.
R-multiple monitoring would only serve as an additional way of risk management, and not as a substitute.
The aim here would be that of knowing how much return and risk have been incurred in achieving the return.
Common Mistakes When Tracking R-Multiples
Several recording errors can reduce the usefulness of R-multiple data.
1. Redefining Initial Risk During a Trade
The alteration of 1R once the trader is already in the trade makes it hard to compare the original risk intended against the result achieved.
Maintain consistency in the original risk unit even when there are changes in stop-loss levels and position size.
2. Ignoring Partial Exits
If closing out of a position occurs in stages, the total gain or loss should be calculated.
3. Recording Only Monetary Results
Earnings and losses are significant, but the use of R-multiples offers an equivalent comparison based on initial risk.
4. Ignoring Trading Costs
Other fees such as spreads, commissions, swaps, etc., can influence net trading outcomes.
5. Failing to Record Execution Mistakes
Execution quality notes can help to determine whether strategy results stem from strategic success or failures in adherence to the rules.
6. Using Inconsistent Risk Definitions
Determine your planned risk at the beginning of each trade, considering the correct position size and instrument details.
7. Drawing Conclusions From Small Samples
A couple of winning or losing trades might not be enough to determine the expectancy or reliability of a trading strategy.
Proper record-keeping and analysis are more important than R-multiple performance figures.
Conclusion: Using R-Multiples to Evaluate Trading Performance
R-multiple trading offers a practical tool for determining the result of a trade with respect to the initial risk level.
Recording R-multiples in conjunction with mistakes made and market conditions can assist traders in achieving a better understanding of their trading results.
R-multiples could also be useful in helping to identify patterns, analyzing historical expectancy and differentiating between problems in strategies and poor execution.
Nevertheless, R-multiples are not necessarily profitable, can not eliminate emotions and can not substitute for correct position sizing and risk management.
The usefulness of the R-multiple trading journal depends on the combination of accurate recording and constant performance assessment.