


Everyone Uses Trendlines
Honestly, everyone uses trendlines. Trendlines aren’t only a guilty pleasure for those traders at home wearing sweatpants. I’ve seen first hand some of the top hedge traders base their trading decisions on them, despite having some of the most complex tools at their disposal. Likewise, I’ve witnessed sell-side strategists at some of the biggest banks use trendlines as the main basis for their recommendations.
A good old fashioned trendline is accessible, uncomplicated, and one of the most effective trading technical tools available. It works across different markets, timeframes and trending sessions. Yet so many traders I’ve come across over the years either draw trendlines incorrectly or use them in the wrong context. Below is a list of common mistakes, misconceptions, corrections, and my own opinions when it comes to drawing trendlines.
Two Points or Three?
You need two points to draw a valid trendline, but it takes three for a trendline to be confirmed. I can’t tell you how many times I’ve observed traders use two point trendlines with overconfidence. Why three points instead of two for confirmation? Well as the old adage goes any idiot can connect two points to create a line. Using only two points leads traders drawing lines all over the place, leaving them more confused about the market than when they started.
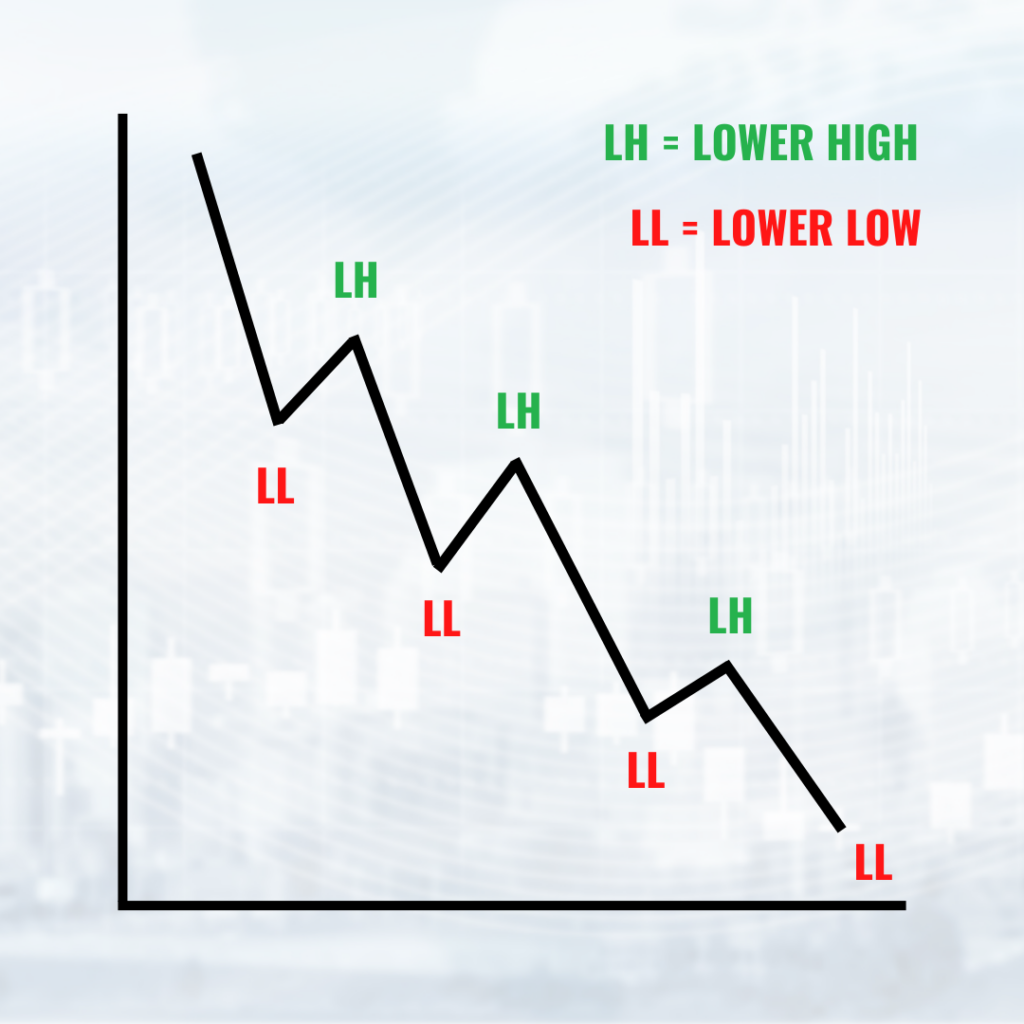
Connecting three, however, is more challenging and carries greater significance. And whilst that may be true, it is not the only reason three points are required. Three points also ensure treadlines incorporate market structure theory, which states that a new higher high (HH) is only confirmed by the subsequent higher low (HL). In turn, that higher low (HL) is then confirmed by the subsequent higher high (HH). Therefore, strictly speaking an upward trend you need a series of three HLs to confirm at least two HHs.
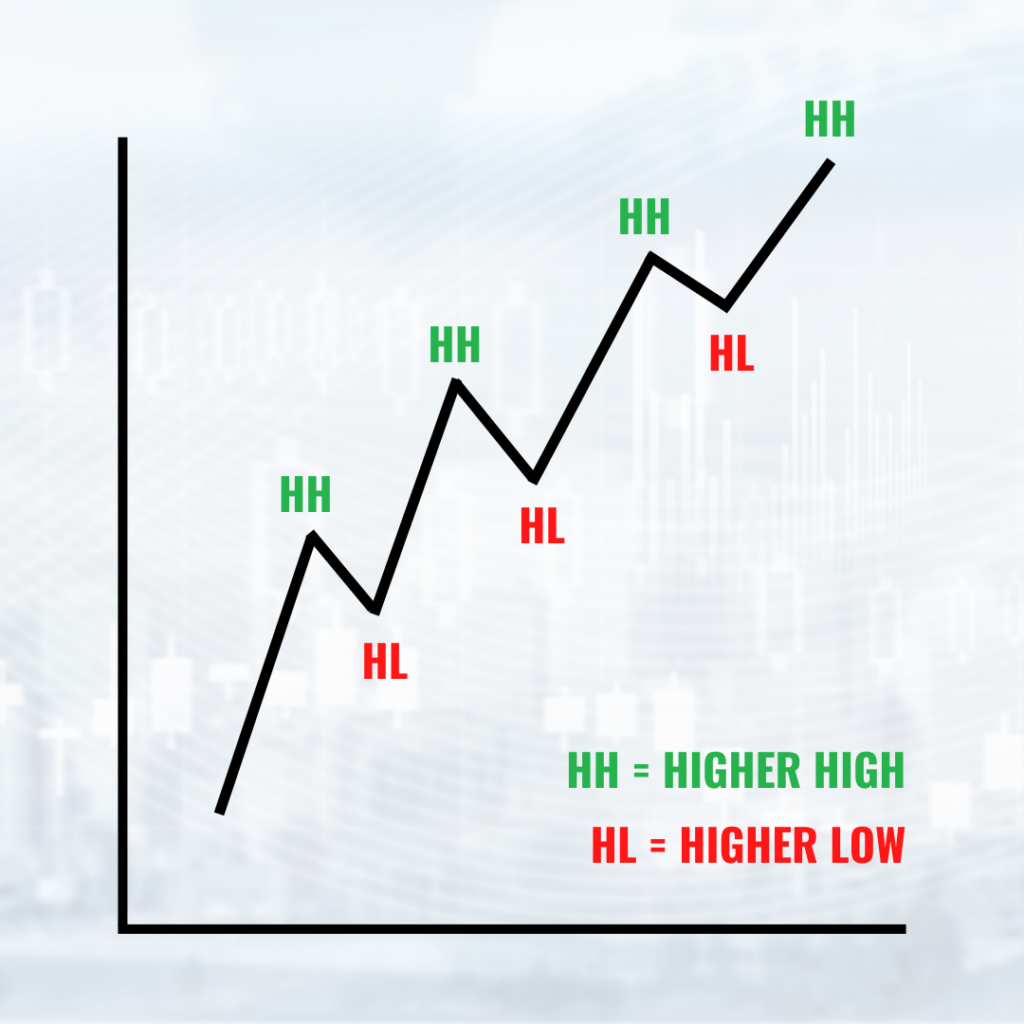
Likewise, a bonafide downtrend requires a new lower low (LL) to be confirmed by a new (LH). Thus two LLs must be confirmed by a series of three LHs. For me, one of the best parts about connecting three points to form a trendline is that it helps reinforce market structure theory in an easy way. Trying to ccnfirm a HH or LL without the help of a trendline is a real headache. If you don’t believe me, try doing it yourself. So, think of drawing trendlines as one of the ultimate trading hacks to incorporate advanced technical analysis. The bottom line is to use three points not two when drawing your trend lines. Anything less will most likely to do more harm than good to your trading.
Upward Below & Downward Above
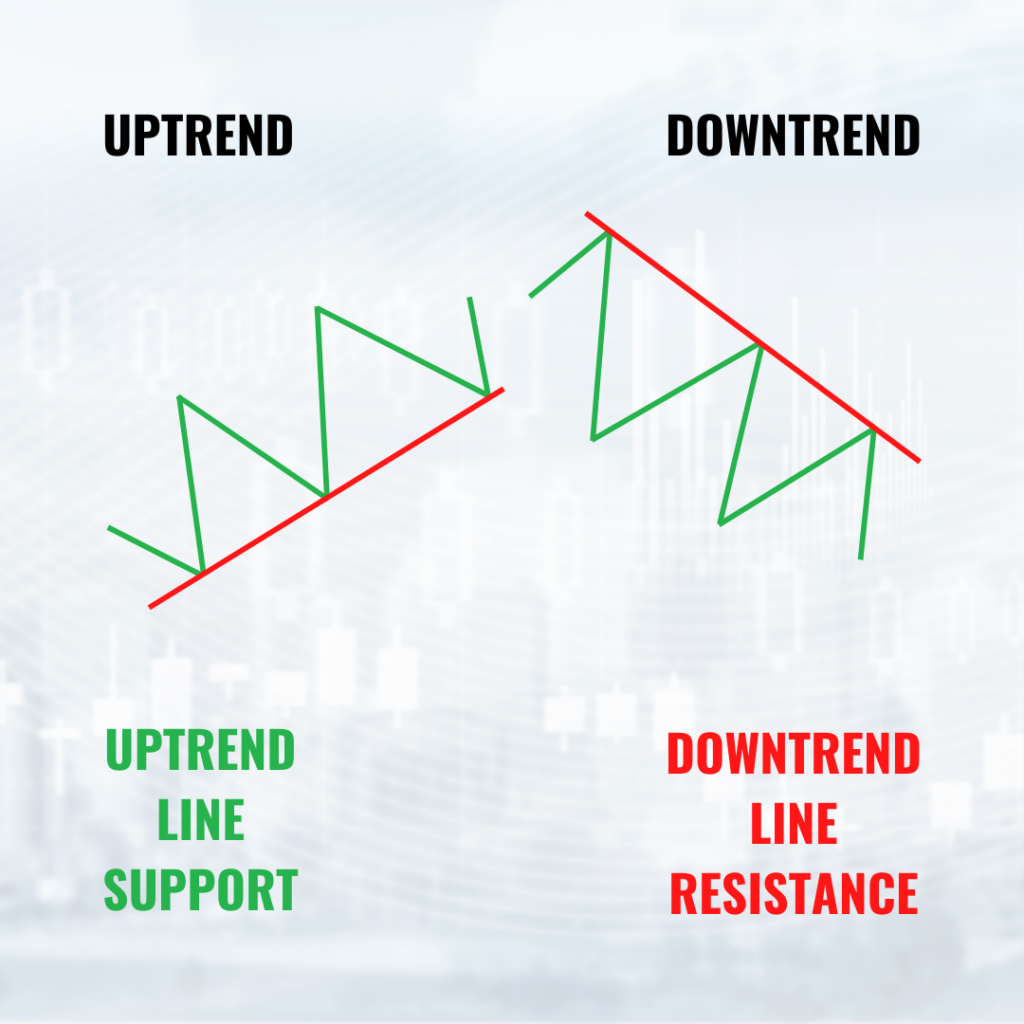
A lot of traders try to draw an upward trendline using HHs i.e. from the topside. Doing so is just downright wrong. An upward trendline should be drawn using LHs, which places them bottom side. Exactly opposite holds true for downward trendlines. They should be drawn connecting points on the topside using HLs. By the way, these aren’t just obvious rules, they also have implications for two of the key ways you use trendlines: to utilise retracements to buy or sell at more attractive levels or spot potential reversals in the trend.
When placed correctly, trendlines act as support and resistance to help traders gauge attractive prices at which to buy into a trend. You don’t want to buy into an upward trend at the closest high only for price only to retrace lower and stop your position out before rising again. Similarly, you don’t want to sell at the nearest low in a downtrend for the price to only rise higher before further declines.
When a trendline is broken, traders should look out for a potential trend reversal or range bound conditions ahead. In these circumstances, many of the traders I know wait to see whether price closes rather than trades above or below the trendline before making that assessment. They also usually seek confirmation from some other signal before making that call. More conservative traders typically wait for price to retest the trendline before committing to any possibility of trend reversal, just as they would do with any support or resistance line.
Trendlines, combined with patience and confirmation from other signals, do help you navigate better buy and sell opportunities when drawn correctly.
Body or Wick?
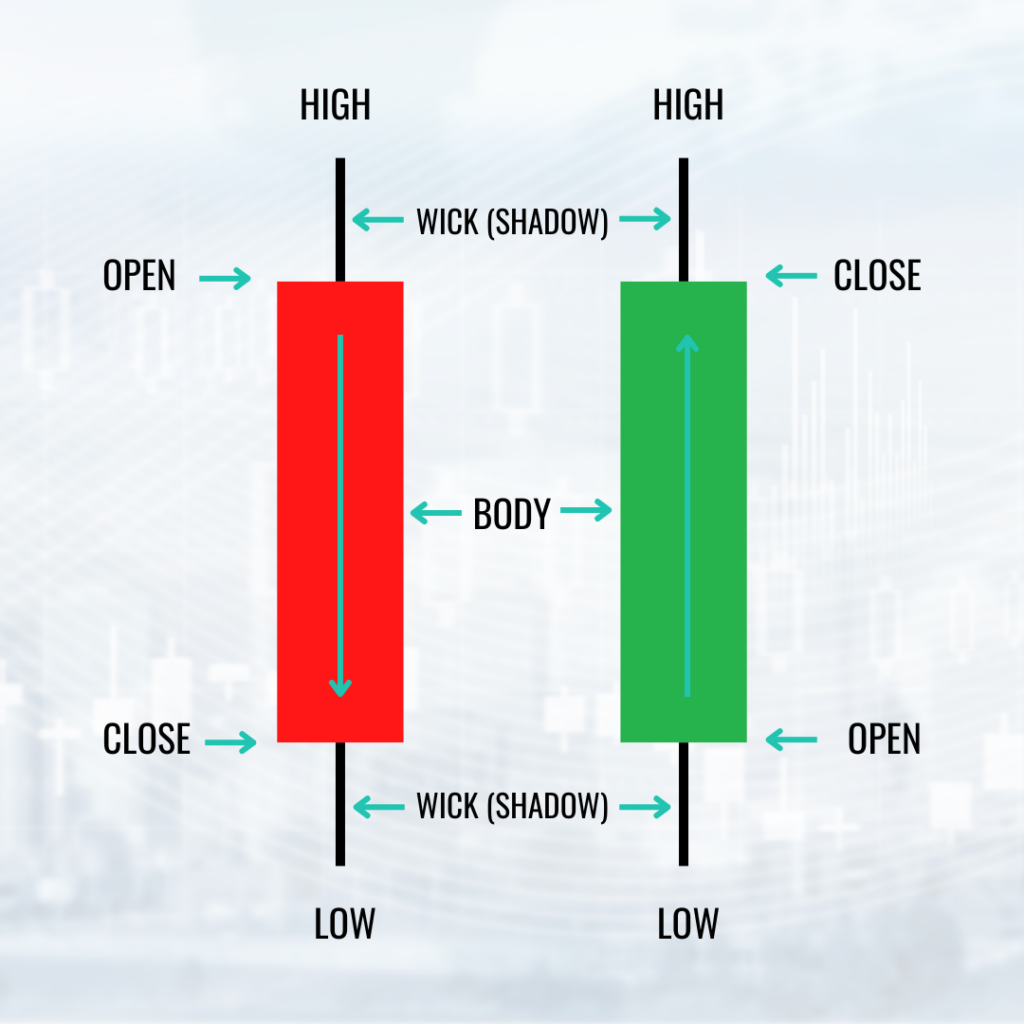
Day to day trading in the 21st century usually involves candlestick charting. Sure, there are other types of charting out there, but none lend themselves to drawing trendlines more than a candlestick chart. As a result, one of the number one questions I hear from all types of traders is whether they should draw their trendlines against the wick of the candle, the body or a combination of both. Unfortunately, there are no strict rules when it comes to using wicks or bodies to draw trendlines. But the decision to do either does have implications beyond just personal preference.
For the most part, I use wicks where possible because highs and lows contain more informational value than just the open and close. For example, if price closes modestly down from the open, but during the trading period shot above the open over the trading period then it is pretty obvious there was selling pressure at those higher levels. If I discount the information in the wick, I risk entering into a possible false break of a downward trend. By solely using wicks, however, I also recognise I am trading slightly more conservatively.
When I mix things up by using bodies and wicks to draw a trendline, I tend to do deeper research on the market context of the price action before drawing the line. The bigger the wick the more investigation I do before deciding to draw a line through a wick. I look at the associated volume, news, and the context in terms of previous price action before making a decision where to draw my line.
No matter which route you chose, traders should never draw a line through the body of a candle. When a trendline doesn’t fit, it isn’t a real trendline!
It's Not Over Until...
Earlier, I mentioned that trendlines were a bit of a hack for traders in terms of gauging market structure. They are, however, not a complete replacement. A broken trend line is a necessary but insufficient requirement for trend reversal. Think of it as more of an early warning. To be true to market structure requires a bit more. To confirm a reversal from an uptrend to downtrend requires the last LL of the downtrend to be broken. For a reversal from downtrend to uptrend, price must break the prior HL of the downtrend.
Slope Matters
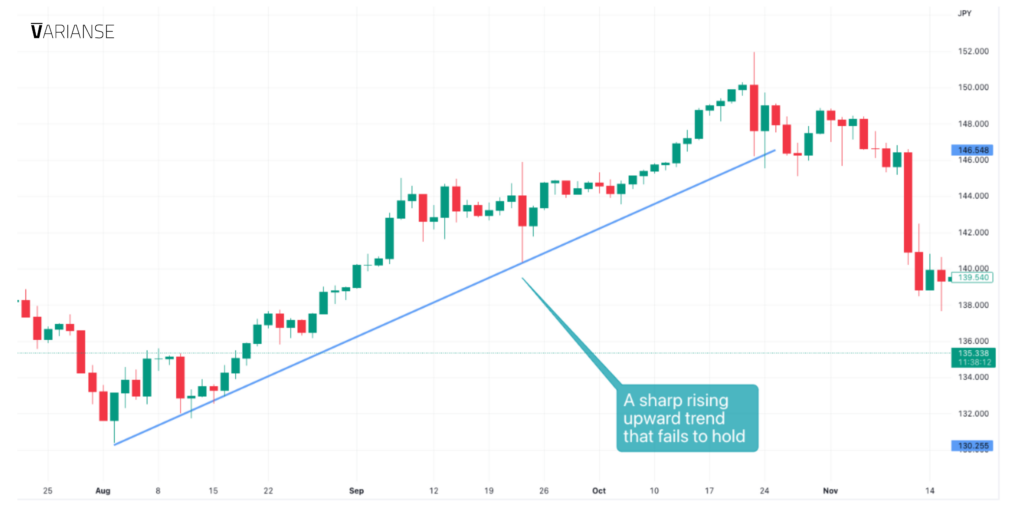
The slope of a trendline does matter when it is extreme. If a trend line is rising or falling fast, then the risk of reversal tends to be higher than if the trendline were more graduated. When price rises fast, odds of a potential reversal typically increase. To be completely clear, I am not advocating high sloping trend lines as a clear reversal signal on their own. A trendline alone is not a good way to make an assessment about reversals even in the case of a parabolic move in price. Traders need a completely different set of tools to gauge reversal potential. All I am saying is that if the trend line is rising or falling fast, a trader should just be alert of the potential risk.
Look Out for Patterns
Two trendlines are a key component to many traditional chart patterns. If traders can draw an upward or downward trendline using HLs or LHs respectively, it is always worthwhile checking out what can be drawn in respect to the corresponding HHs and LLs. Triangle, pennants, and wedges all require two trendlines (in some cases a combination of one two point line and another three point line). By default, whenever I am able to draw a trendline, I am also on the lookout for any potential chart patterns.
Lines Are Meant to Be Crossed
Douglas MacArthur, the famous twentieth century American general once said, “Rules are mostly made to be broken and are too often for the lazy to hide behind.” The same can be said for trendlines and traders. As diagonal support and resistance lines, trendlines are commonly believed to be less likely to hold than their horizontal brethren. Traders often forget that little tidbit. The concept also seems contrary to the other commonly accepted adage that the more price touches a given trendline the greater its significance.
Many of the traders I’ve met have a really difficult time balancing those two concepts. I’ve made my peace by staying completely open minded in terms of where price can go as it approaches a trend line. Acting conservatively and being ready to play the possibility of a trend continuation or trend reversal puts my mind at greater ease.
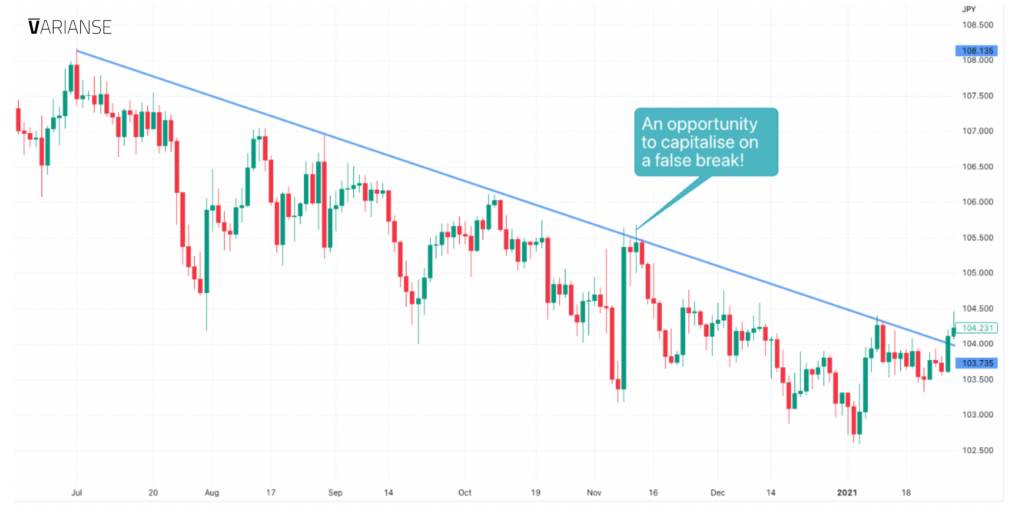
What’s more, as clearly sign posted areas of support and resistance, trendlines provide traders with a unique opportunity to gain from pockets of liquidity. An astute trader knows that trendlines are where others are most likely to place their stop losses. Better to let prices push beyond an obvious trendline, forcing stop orders and allowing buying or selling at more attractive prices before trend continuation. Great traders are aware of the risk of false breaks and seek ways to capitalise on them just as they would plain vanilla trend continuation and reversals.
Never Alone
Trendlines alone are insufficient to base your trading decisions. They simply don’t convey enough information about entry, exit, or future direction. Traders need additional tools to confirm the existence of a tradable opportunity. Those tools are beyond the scope of this article.
Also, I would be remiss not to mention that trendlines aren’t necessarily the quickest way to identify trends. Don’t forget to truly confirm a trendline you need three points. Waiting for those three points could take quite a while to form. Moreover, a trendline does carry a level of subjectivity. Using moving averages does have the potential to pick up trends faster and require less subjectivity. For those looking for a deeper understanding of moving averages, check out my article on exponential moving averages.
Next Steps
Traders should take some time out and practice drawing trend lines armed with the knowledge above. Well practiced traders, using the right trendline techniques, spot more profitable trading opportunities. Once a trader has mastered trendlines, the next logical step is to segway into drawing channels. This is a topic I will cover in an upcoming article. Channels convey an extra bit of information that can help uncover potentially more profitable opportunities than trendlines alone.
Just remember, trendlines, no matter how well drawn aren’t a bonafide trading strategy unto themselves. They require other types of tools and analysis to spot trading opportunities before putting any capital at risk.