


My First Renko Experience
Renko charts were first introduced to me at a Bloomberg technical analysis seminar more than ten years ago. It wasn't love at first sight. The presenter, a die hard Wycoff Method zealot for most of his years, didn’t really do a great job of selling them. His approach to using renko charts was too highly prescriptive for my liking. By that point in my career, I’d been around long enough to know that trading is an art and not a science. Being too rigid in trading never pays in the long run. Without much further consideration, I cast renko charts aside and moved on with my life.
No Concept of Time
Something of what the presenter said, however, must have stuck. A few years later, renko charts popped back into mind, but for reasons not wholly related to trading. Instead, I was reading a magazine article about how some physicists don’t believe time actually exists. Time, according to them, is just the way the human mind is wired to observe the universe around us. Suddenly, I recalled that renko charts, unlike the common bar or candlestick chart, also don’t incorporate time. What if the renko charts I had dismissed all those years back held all of the world’s trading secrets, if not the answers to the entire universe?

Iconic Brick Formations
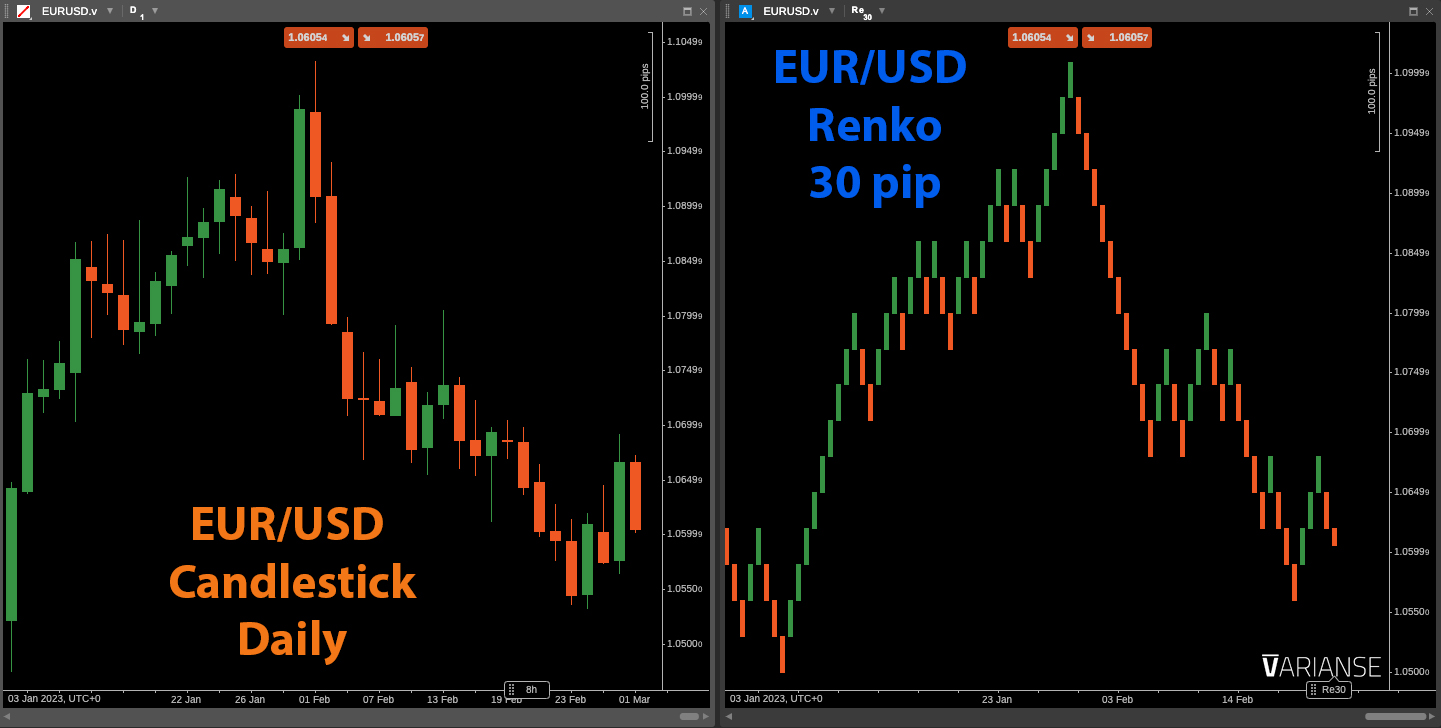
Truth be told, my experiments with renko charts failed to offer any such epiphany. Still, they did prove immensely helpful for my trading despite being relatively simplistic. For those unfamiliar, the name renko derives from “renga”, the Japanese word for brick, as the chart type originates from Japan. Unlike the household bar or candlestick chart, which track the open, high, low, and close (OHLC) over a given time frame, Renko charts substitute time for price movement in a given direction, creating a graph of evenly spaced blocks. The end result is something that looks like a chart of lego blocks.
The Inner Workings
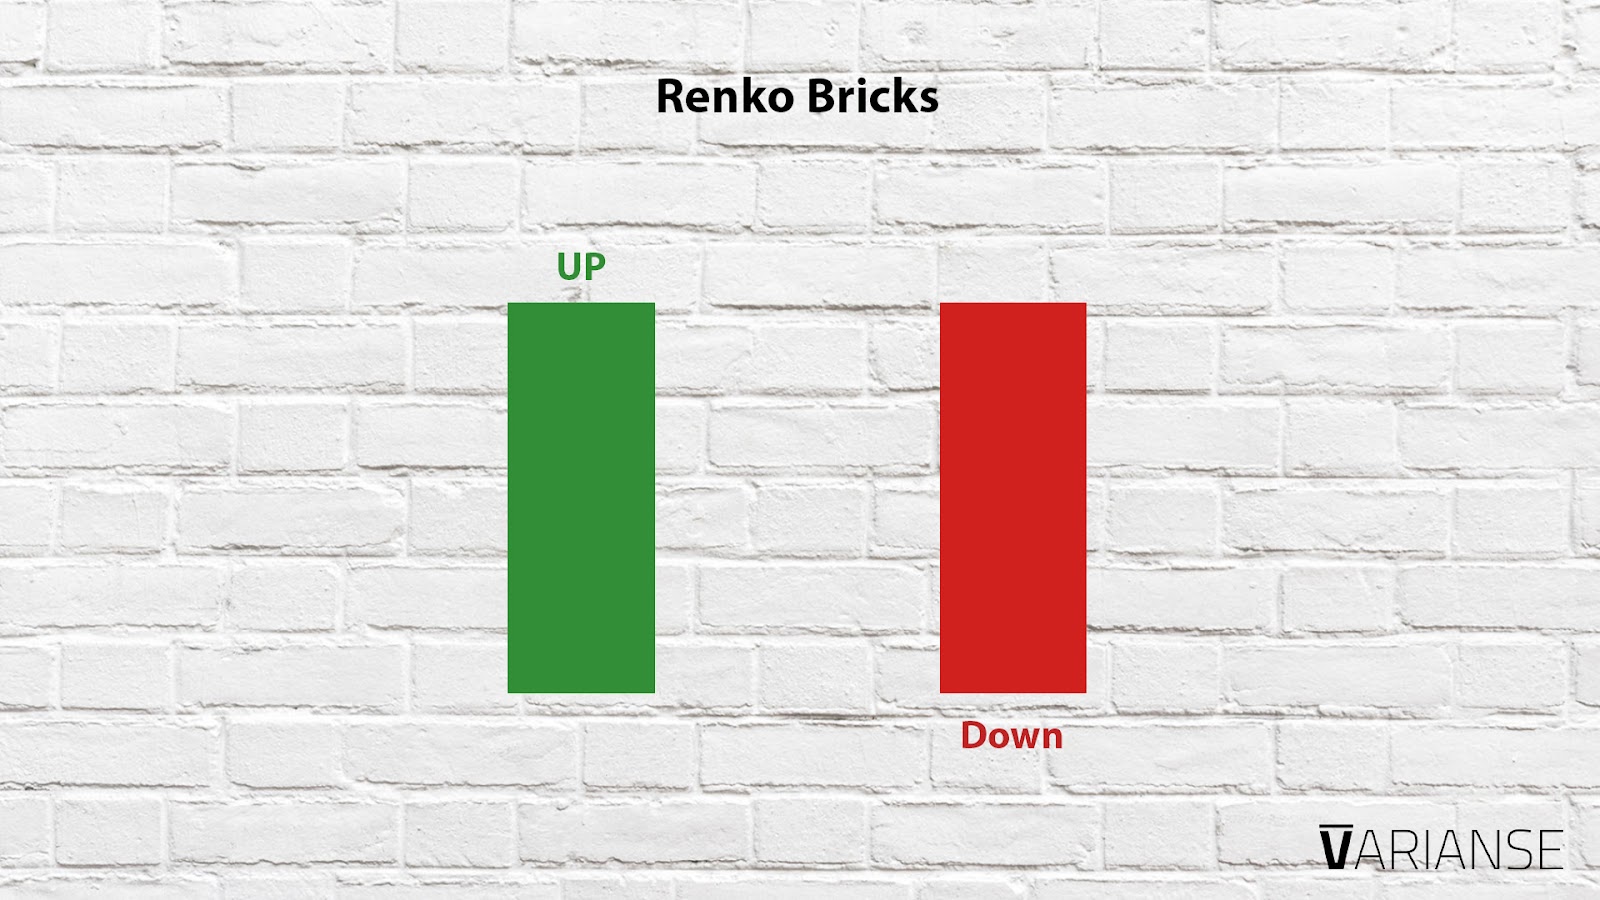
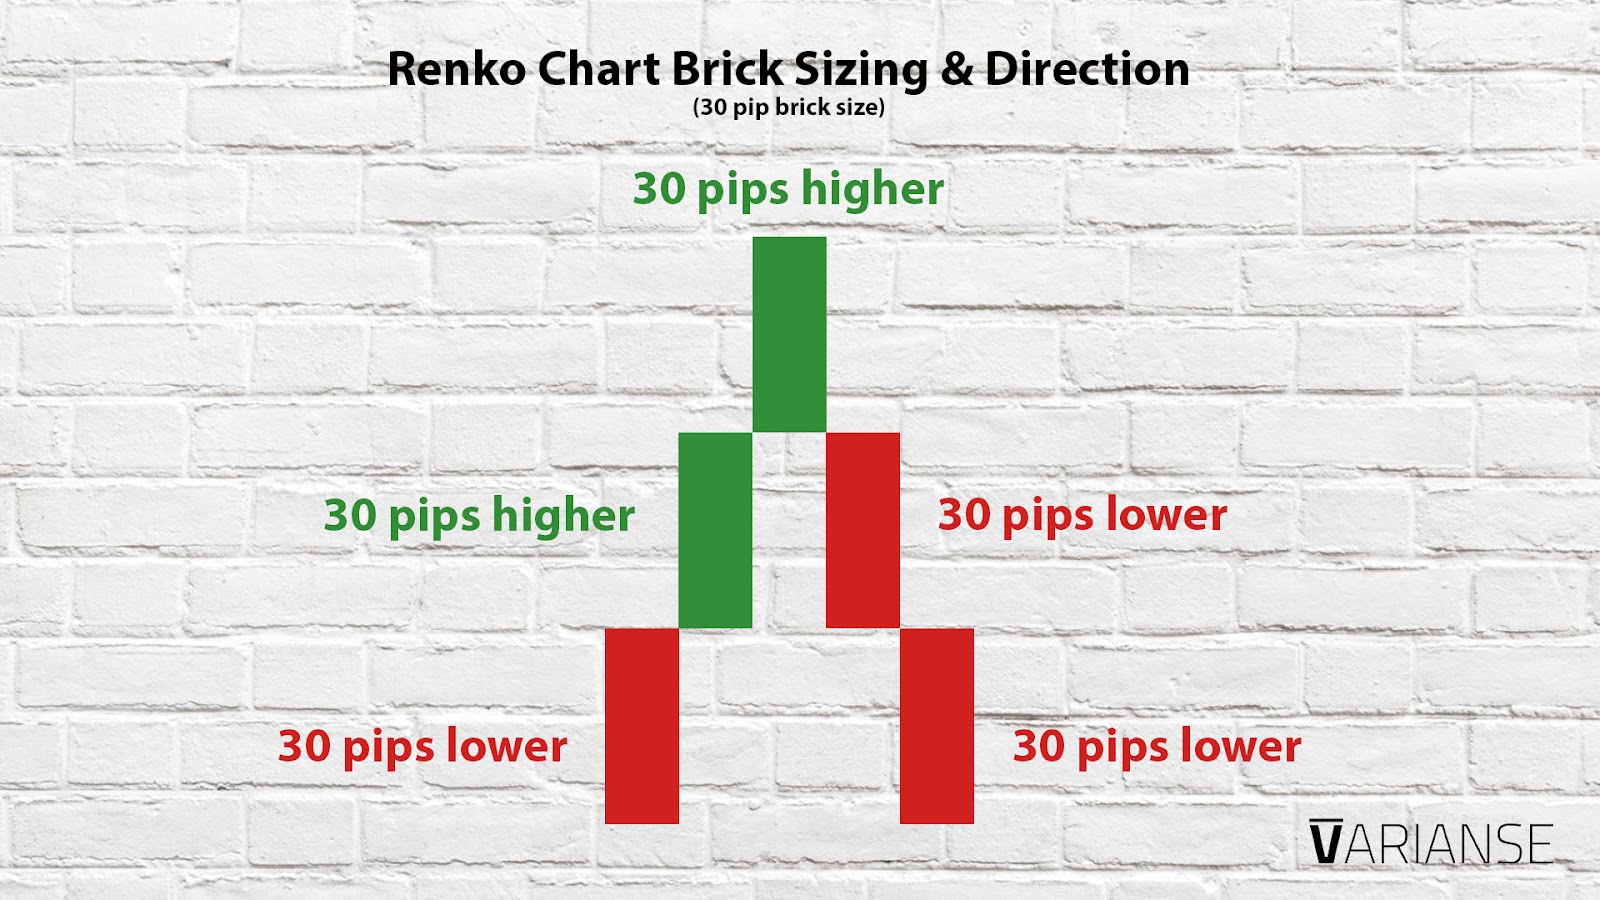
To use renko charts effectively, like other advanced trading tools, requires an understanding of how they work. Thankfully, the concept is simple. Every up and down brick created by a renko chart is assigned a colour. I do my trading analysis on cTrader or TradingView, where by default an up and down bricks are represented by the colour green or blue, respectively. Other platforms may vary. New bricks are formed at a 45 degree angle to the prior brick, when price moves in a single direction by a specified amount set by the trader. Brick size can either be denominated in pips for forex, US dollars for futures, points in relation to indices, or whatever is appropriate for the trading instrument in question.
Irrespective of one’s beliefs, by substituting time for price moment, renko charts do an incredible job of removing the incessant noise found on other time based chart types. No big wicks, wide bodies, or confusing series of candles or bars. At the very least, they make spotting the prevailing trends in whatever market and at any point easy.
Different Settings
How a trader sets the specified amount of movement in price before a new brick forms is at their discretion. Some traders chose to stick with a single setting. For example, 10 pips, 20 pips, 30 pips or even 50 pips. The bigger the renko block - the less noise, but also a lot less movement on the chart. Others, choose to adjust their bricks dynamically based on a volatility indicator such as the average true range (“ATR”), a topic I go into way more depth in another article. Setting box sizes by fixed amount lends itself to consistency, while a dynamic brick setting captures more of the recent range for the instrument in question.
How to Use Renko Charts
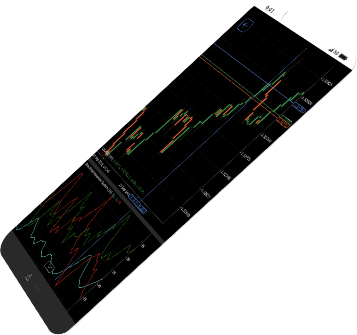
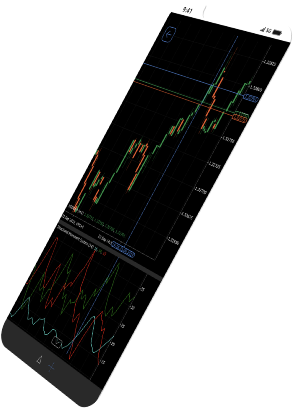
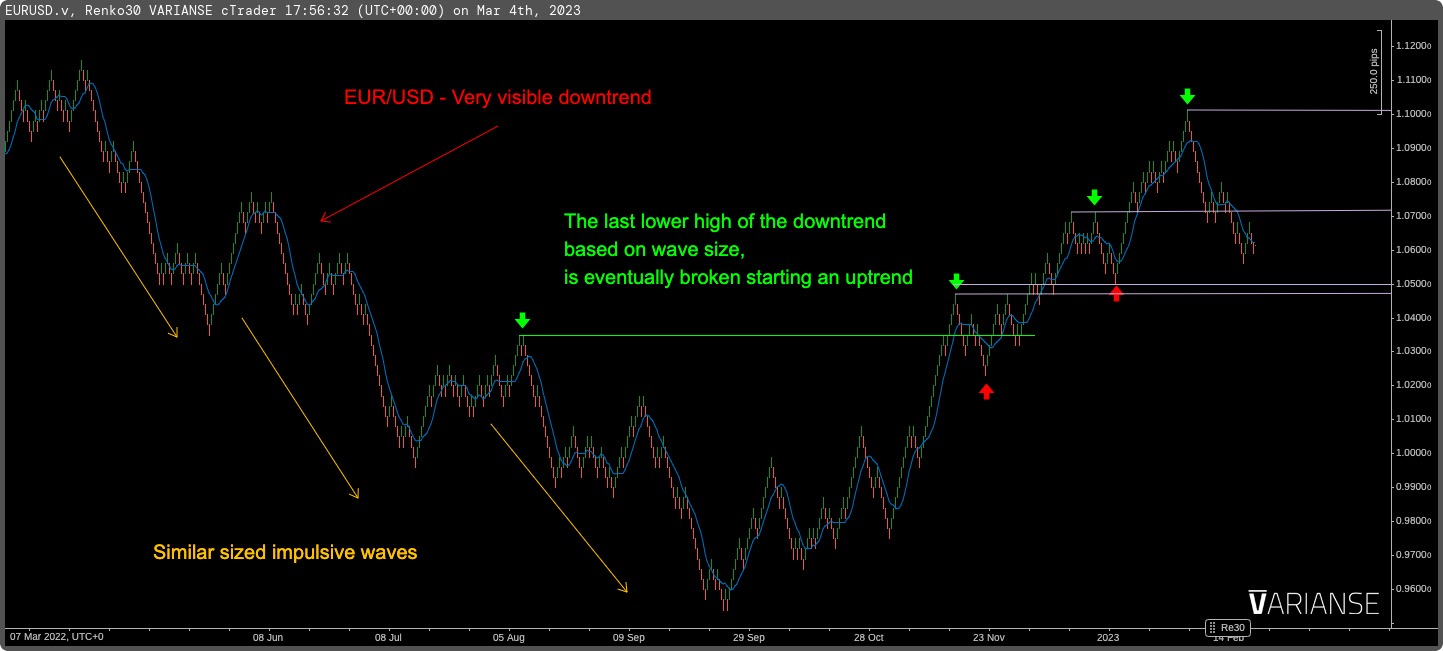
Armed with the knowledge of how renko charts work, it is time to delve into how they can help traders. Renko charts are all about easily spotting the prevailing market trend and general support and resistance areas. Think of them as the eye in the sky offering up the bigger picture. In a prior blog bost, I outlined how to spot trends using the swing highs and swing lows of markets. Renko charts make spotting highs and lows, and the similar sized impulsive and corrective moves that create them a lot easier. If the chart art below looks indecipherable, don’t worry I discuss the topic in another blog article I wrote.
Trading Off Renko
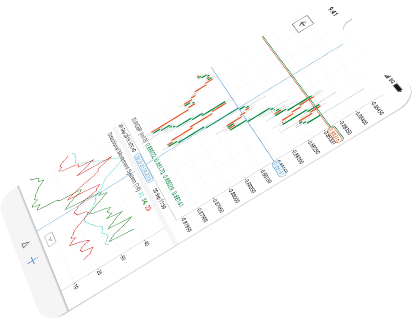
Renko charts, however, aren’t limited to spotting trends and big support and resistance areas. All sorts of analysis and strategies can be applied to them. A very common strategy employed using renko charts involves adding short and long-term moving average crossovers into one’s strategy. Bear in mind that on a renko chart, moving averages are calculated based on the closing price of each brick. Results of these types of strategies may vary depending on the market being traded and underlying conditions. Traders need to do the analysis to find out what may work best for them.
Notable Drawbacks
Renko charts are good, but they do come with some major drawbacks. Above all, by focusing on price rather than time, renko charts miss important price extremes. For instance, a renko brick set to 30 pips and price moves down by 25 pips, before going up by 30 bps. In this case, the initial 25 pips decline in price doesn’t appear on a renko chart, whereas candlestick charts do illustrate such price movement. Likewise, exact support and resistance levels are not identifiable. In a non-trending market, it could take quite a long time before a new brick to print. Hence why swing traders are more likely to trade directly off a renko chart, while most scalpers and day traders may only use them for reference.
Differences Across Platforms
Traders should be aware that different platforms calculate renko charts differently. TradingView, in the absence of pure tick data, uses the OHLC over a designated chart timeframe to determine brick creation. The highest frequency chart in TradingView will more closely resemble a traditional renko chart than one of a lower frequency. Meanwhile, platforms like cTrader actually calculate renko charts using tick data, but don’t offer built in dynamic box sizing using something like the ATR.
Final Thoughts
Renko charts are extremely helpful in getting a big picture overview of the market one trades by cutting out the price noise of more traditional chart types. I personally use renko charts to determine trends based on market structure and also to spot swing trade opportunities. Easy to construct and understand, renko charts are definitely a valuable tool for any type of traders. Still, they do have their drawbacks, especially for scalpers and day traders.