


The Average True Range or ATR
In a prior article, I mentioned how, as a largely fundamental and price action trader, I rely on only a handful of traditional technical indicators as part of my everyday trading. One of them is the average true range, which is commonly represented by the initials ATR. This indicator is so versatile in terms of application, I rank it as my second favourite technical indicator, just behind the exponential moving average. Whether I am forecasting the potential profit on a trade, deciding on position sizing, or setting a stop loss, I find myself constantly referring back to the average true range on a daily basis.
Truly Versatile
Why the deep love affair with this technical indicator? Honestly, I love it because it provides me with an easy to understand measure of rolling historic volatility calculated in pip values. Volatility when represented in pips, or another base denomination of a trading instrument is a lot more practical for traders than the stylized annualised percentage rate typically used in options markets or in other quantitative settings. Once you know how much in pips on average a currency has moved over a given period, you can then apply this information in all sorts of ways. In my opinion, using the average true range is one of the simplest ways for online traders to incorporate a more quantitative approach to their trading without the need for an understanding of advanced mathematics.

A Long History
J. Welles Wilder first introduced the average true range indicator in his book New Concepts in Technical Trading Systems in 1978. If you aren’t new to trading, you’ve probably heard of Wilder’s name before; he also created many of the most commonly used technical trading indicators such as the relative strength index, average directional index, and parabolic SAR. Just like most of Wilder’s indicators, the average true range was first developed with commodities markets and daily price movements in mind. Since its invention, however, the indicator has been applied to just about every market imaginable, including forex, stocks, indices, etc. The average true range is one of the most versatile technical indicators that has ever been created.
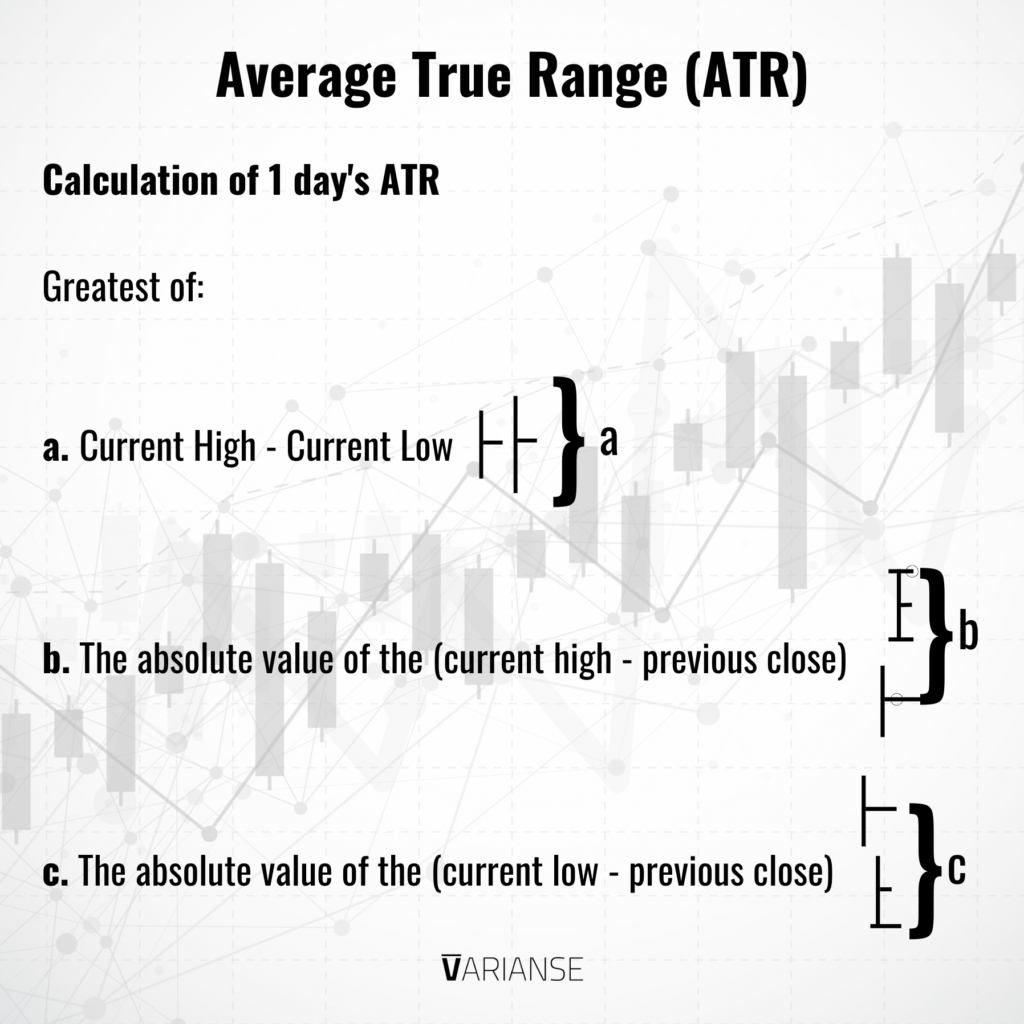
The Methodology
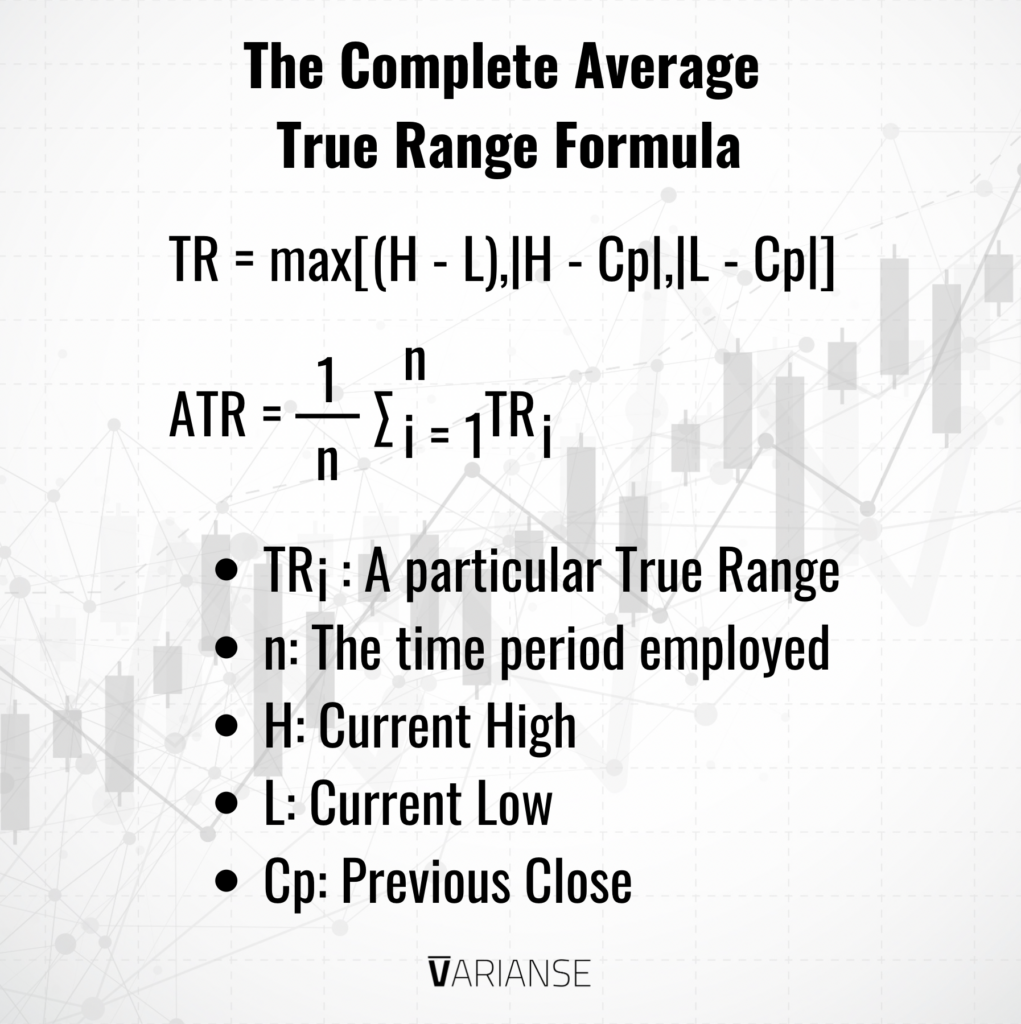
A large part of the average true range’s versatility lies in the "true range" part of its calculation. By taking the greater value of three different options, the volatility measure adjusts for price gaps. Furthermore, the calculation is based on absolute value of price differences. As such, it's a true volatility measure, but referenced in terms of the instrument in question's base denomination. What average you chose to apply and for what timeframe is totally up to the trader. The default setting is the 14-period simple moving average.
Meaning & Worked Example
That seems logical, but what does that number really mean once calculated? Simple, it represents the average absolute movement in price for a given timeframe over a certain period. The more volatile the average true range then the higher the average true range. Less volatile a pair, the lower the average true range. Volatility, however, doesn’t give a trader any idea of direction, just movement.
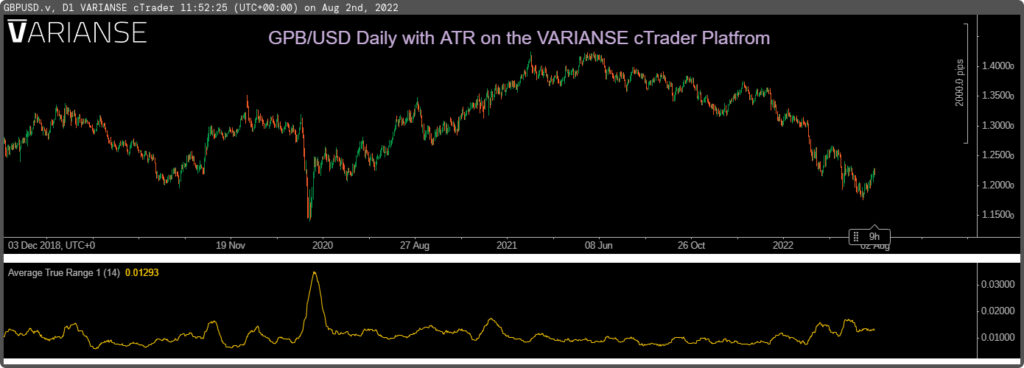
For example, let's say the 14-day moving average for the daily GBP/USD average true range is 0.01200 or 120 pips. Assume the current price is at 1.2200. All this means is that the pair fluctuated by that amount in either direction . But armed with that knowledge, a trader can make assumptions about the potential moves going forward.
Average True Range Projection
Based on the data above, GBP/USD could be expected to move up or down by 120 pips over the next day. In other words, prices at or between 1.2320 to 1.2080 should be expected. Apply that same ATR to this forecast, implies price could reach a high or a low of 1.2440 and 1.1960 respectively the day after next. This is calculated by just adding and subtracting the 120 pips from the prior forecast. Repeat this step for each timeframe for however many periods in the future one would like to project.
Setting Stop Loss
Mapping the expected price path has two important applications when it comes to trading. First off, the expected high or low implied by the average true range can be a good guide in terms of placing a stop loss. When price movement exceeds the average true range then there is a statistical basis to say its gone wrong. Therefore, prices implied by the average true range are as good a place as any to consider placing stop losses.
In practice, price volatility can itself be volatile. So, many traders take a multiple of the average true range when setting a stop loss. Then they base their stop loss off twice or three times the average true range value. Quite a few set their trailing stop loss this way by also adjusting each new stop loss level to match the latest average true range calculation.
Others also combine the average true range with existing support and resistance to determine stop loss levels. By adding the average true range to such obvious price levels helps avoid being inadvertently stopped out too early. I personally find the average true range particularly helpful in that regard.
When to Take Profit
The second way the ATR can be useful is when trying to map your potential areas at which to take profit. Let's refer back to our GBP/USD example, where the high expected price on day two is implied at 1.2440. If a trader had a long position, they might think about scaling out at that level. The same would be true if they were short and price exceeded the expected low of 1.1960. Here, the rational is that price has more less moved to the expected extreme and therefore could easily snap back, all other factors held constant. Again, in many cases traders will not only look at the average true range, but also multiples depending on the situation.
Sizing Up Positions
Lastly, the ATR can be used without any adjustments to determine relative position sizing of potential trades. The higher the average true range for a forex pair then the less capital should be committed to a trade in comparison to another of a lower value. Higher volatility simply equates to higher risk. By adjusting their position sizing based on volatility rather than by a fixed amount, a trader is better able to manage both their risk and return. The average true range can make the job identifying the most and least volatile currencies a lot easier. For more information on positioning, check out my article on risk management.
Final Thoughts
The ATR is an extremely versatile indicator that can help traders both in terms of their risk management, but also general understanding of markets. No other indicator makes understanding historic volatility easier than the ATR. That’s exactly why I incorporate the ATR into my everyday trading.
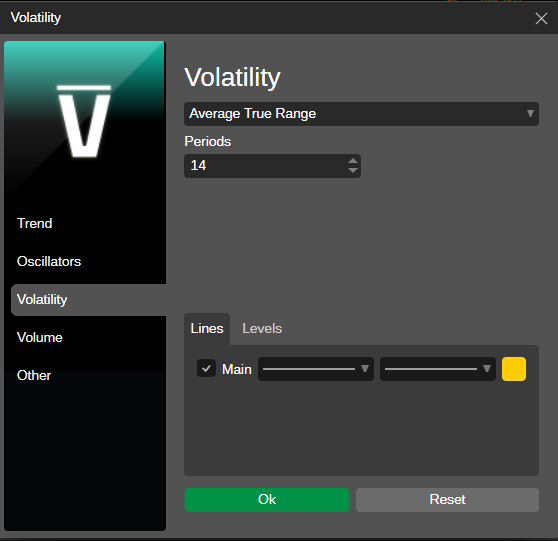
Even better, calculating and displaying the average true range indicator has never been easier with the VARIANSE cTrader platform. The indicator, and the ability to adjust the average time period settings are fully built in. That’s just one of many reasons why you should sign up for an account with VARIANSE today.