


Volume Profile Is My New Toy
If you’ve been keeping up with my blogging, then you’ll know that my forex trading style is firmly guided by fundamentals and price action. As a result, I like to keep my use of technical indicators basic. For example, the exponential moving average and average true range have stayed with me throughout my trading career. But since I started trading online full time in October 2021, I’ve begun to broaden my horizons when it comes to new trading tools. Some have stuck. Others haven’t. Volume profile happens to be one of those new additions that I now rely on daily.
Volume Profile Is Easy
For the record, I’ve never been a volume analysis zealot. Past efforts with volume spread analysis, for example, didn’t resonate. Mapping candlestick spreads to shifts in volume always felt far too subjective for my liking. By presenting volume at various price levels rather than at periods of time, however, volume profile side steps many of the pitfalls associated with volume analysis more generally. Moreover, the y-axis presentation volume profile easily accommodates more traditional forms of technical analysis, such as simple support and resistance.
Volume Profile Adds a Third Dimension
Even a rudimentary understanding of volume profile will divulge a third dimension to your trading that you never knew existed. For instance, previously invisible support and resistance zones reveal themselves. With just a bit of knowledge, you will uncover ways to gauge the probability of trend continuation, reversals and range bound opportunities. Price alone says a lot, but price and volume combined weave a superior tapestry of information. Become a master and you will even find yourself tightening your stop losses for better risk-reward trades.
Two Big Warnings
Just two warnings before I jump head first into the details. First, forex has no centralised exchange to track trading volume. Instead, brokers use tick data as a proxy. That’s only ok if they provide rich pricing feeds. Second, volume profile indicators are data heavy and complex. Only top quality indicators will do the trick. To be frank, before adopting the VARIANSE cTrader platform and acquiring the ClickAlgo free and paid volume indicators, I never really had the confidence to start using volume profile in my daily trading. In summary, make sure you have the right broker and indicator provider.
Auction Market Theory
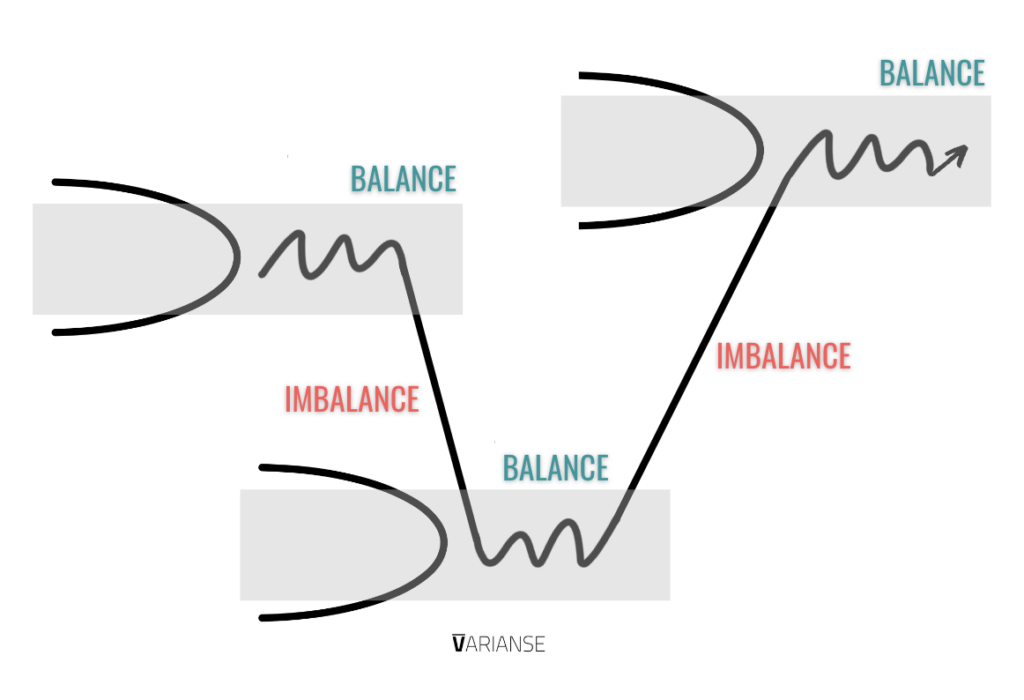
Volume profile analysis is rooted in the concept of Auction Market Theory. That's a complex sounding name for a handful of basic principles. At its crux, is the idea that price and value can be distinct from each other. As a result, every type of market, including forex, moves from periods of imbalance to periods of balance. In turn, market participants constantly trying to establish a fair value price. Based on these principles, those following the theory either look to: 1) enter a trade in the direction of any imbalance if strong or 2) fade the imbalance if confidence is weak.
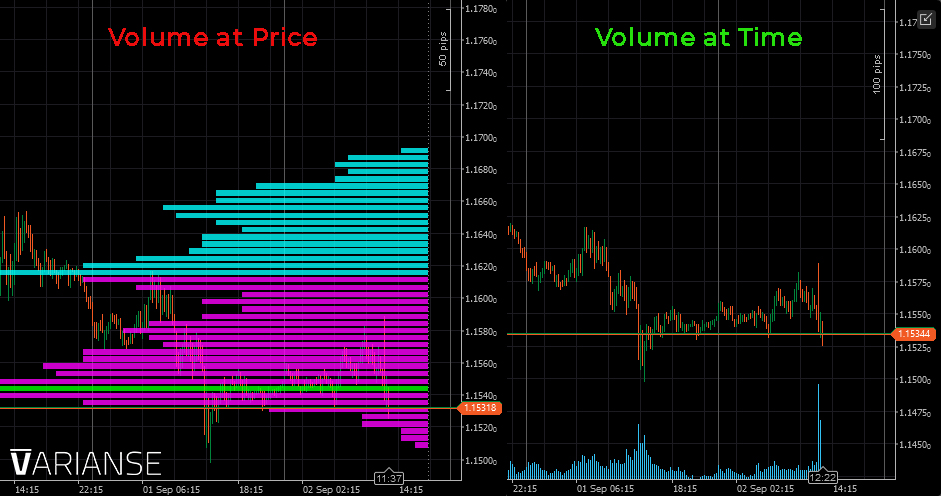
Volume Profile vs Market Profile
In the context of Auction Market Theory, volume profile simply helps to identify where potential areas of fair value exist by looking at price levels that attracted the most volume. Don’t confuse volume analysis with market profile analysis! Market profile analysis uses time at a certain price to derive potential areas of value. Although they share similarities, their end results can differ dramatically. Remember, just because price resides at a level for a long period of time doesn’t necessarily mean it traded with a lot of volume at that level.
Point of Control
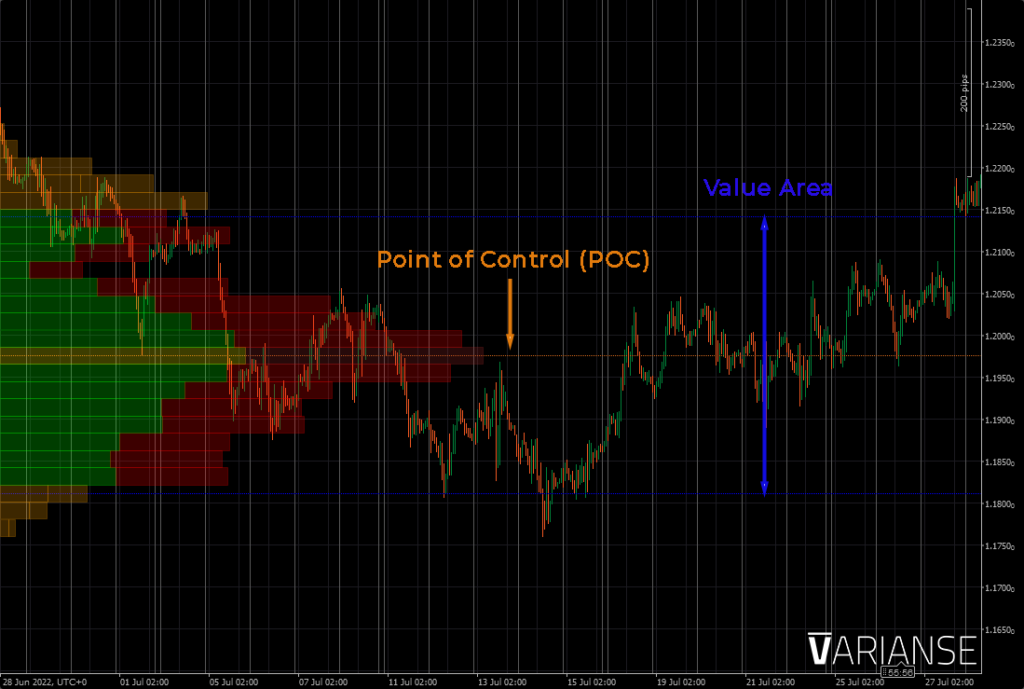
Volume profile analysis all starts with something called the point of control, typically abbreviated with the initials POC. The POC represents a given price range that has experienced the highest degree of trading volume. Theoretically, the POC represents the “fairest of the fair” in terms of price and volume. This is the place where both a lot of buyers and sellers agreed in terms of price. In addition, it acts as the starting point for calculating the rest of the volume profile. If price trades close to the POC, that typically suggests the price is fair, and there is no value to trade.
Value Area
Once the POC is established, the remainder of the volume profile traditionally consists of the 70% of volume and price levels adjacent to both sides of the POC. More specifically, this 70% represents the remainder of volume 35% above the POC and 35% below the POC. All together, this segment of the traded volume is referred to as the value area. The POC and value area represent the real first point of fair-value reference. The 70% of volume represented by the value area along with POC aren’t arbitrary calculations, they mimic the area covered by one standard deviation of a normal distribution.
All About Extremes
Whilst prices are far from normally distributed, the idea of mimicking a normal distribution is to provide a degree of framework to measure extreme moves. In truth, many volume profiles over just a single session will show what appears to be an additional distribution or more outside of the value area. Most, if not all volume profile chart studies, like those provided by ClickAlgo, also give the option to mark the end of the value area.
Volume Areas
The topside limit of the volume area is referred to as the value area high and the bottom side as the volume area low. I find this feature particularly handy in visualising where the value area starts and stops, as volume bars outside of the value area are still displayed, albeit in a faded colour. Some of the most effective applications of volume profile require a trader to have a clear understanding of where the volume area starts and stops.
High Volume Nodes
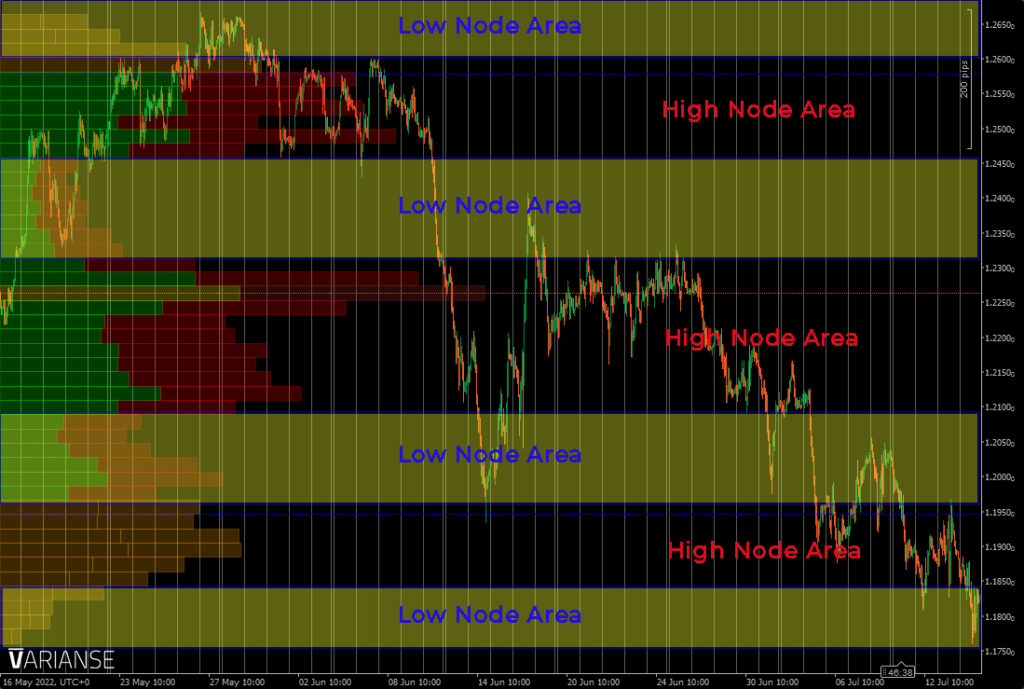
Before moving on, there are two more pieces of volume profile anatomy every trader needs to know: high volume nodes and low volume nodes. A high volume node represents price levels that have experienced relatively high levels of volume or balance. It attracts price, as that is the level where a large number of buyers and sellers showed agreement in terms of price, according to volume profile adherents. POCs are high volume nodes, but not all high volume nodes are POCs.
Low Volume Nodes
Meanwhile, low volume nodes are the exact opposite. Such areas represent imbalance, rejection and are considered unfair. Volume here is low. Low volume nodes look like valleys versus high volume nodes that look like mountains. Therefore, according to volume profile theorists, they represent areas of rejection. Rejection in volume profile terms, however, can mean a move back to a prior value area or a quick move through the low volume node.
A New Kind of Support & Resistance
Armed only with above knowledge, traders can begin to use volume profile to inform their every day trade decisions in a similar way that complements traditional support, resistance, and pivot analysis. Low volume nodes area become areas of support and resistance. High volume nodes resemble areas of attraction and price pivot. One advantage of using volume profile is you set the indicator over any set period of time you desire. Whether it be a single session, over a couple of days, or even weeks for your desired time periods, or just over the visible area of a given chart, you can use volume profile.
What to Learn Next?
Once you've got a good grip on how to use volume profile over set time frames, the next step is to compare volume profile over individual sessions. Observing how volume profile evolves between periods of balance and imbalance can give you an extra edge on determining whether trends are likely to continue, reverse, or if price is more likely to stay rangebound for a period of time. That's a topic I will be covering in an upcoming blog article.