


Trends Don’t Last Forever
Lou Mannheim, the fictional grey-haired broker from the 1987 movie Wall Street, always gave great advice. In one iconic scene, Lou says to the younger Bud Fox, who just began making money from insider information, “Kid you’re on a roll. Enjoy it while it lasts, ‘cause it never does.” Today’s real world momentum traders would benefit from similar advice. Trending markets don’t trend forever, and when the music stops, P&Ls more often than not, end up taking a bruising. Good risk management skills can help avoid catastrophe when markets shift gears, but adopting tools designed to spot big trend changes offer tremendous opportunity to profit. While the Commitments of Traders report is far from Bud Fox’s insider trading, it is one major tool professional traders use frequently to spot trend changes.

Where to Get Started
Unfortunately, I find that a lot of traders don’t use the Commitments of Traders report or COT for short, because without guidance, its contents can prove unwieldy. Established in 1924, the COT has changed reporting standards more than a few times and covers a lot of different markets, making it particularly difficult to navigate. Moreover, the COT is only a powerful tool when used in the right context. If the COT is new to you, I guarantee by the end of this blog post you will have mastered how to use it as an effective forex trading tool. Those more familiar with the COT will still have something to benefit from some more of the advanced topics covered.
What Is the Commitment of Traders report (COT)?
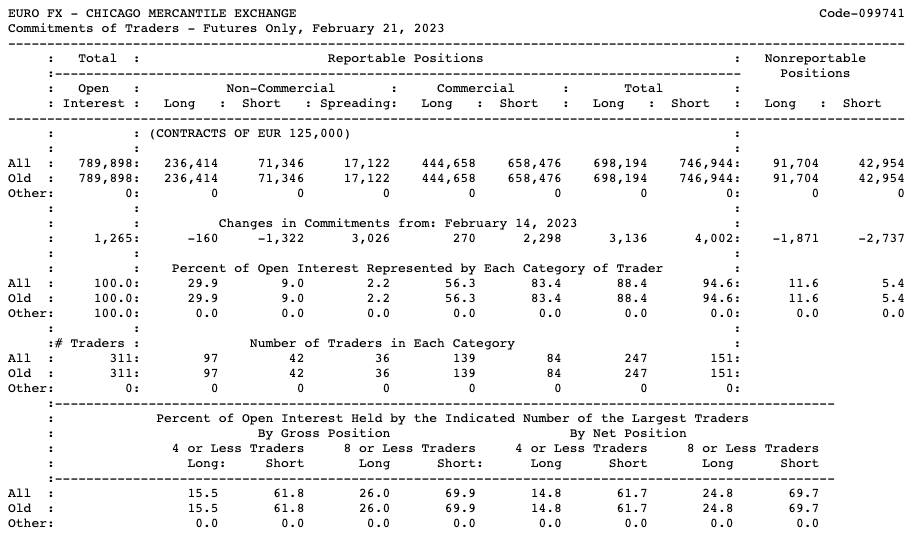
Released by the US Commodity Futures Trading Commission (CFTC) every Friday at 10:30 a.m. ET, the COT provides, amongst other things, a list of open speculative long and short positions in the futures markets. Traders use the report to gauge whether a given market is positioned extremely long or short and ripe for a reversal. If long positions relative to short positions are at historically extreme levels, astute traders begin to question how many more buyers are left to possibly push prices higher. In contrast, a high number of short positions relative to those long may suggest a lack of fresh selling power. Relative positioning is typically calculated as the net difference between speculative long and short positions. You can find the report in its original form here.
Which Data Points to Use?
As I previously highlighted, the COT report is difficult to navigate, in part because of the breadth of coverage. Forex traders should avoid using any of the data related to emerging market currencies and cross exchange rates, as the data is underpinned by low volumes. In total, futures account for c. 10% of the foreign exchange market. This is sufficient enough of a share to make them a good proxy for overall positioning, but most of the activity is heavily concentrated in the seven major currencies against the US dollar, which are the:
- Euro
- British pound
- Japanese yen
- Swiss franc
- Canadian dollar
- Australian dollar
- New Zealand dollar
The Easiest COT Data Source
Getting the data from the original source document into a usable time series format from which you can draw some conclusions can prove to be another real challenge with the COT. Thankfully, there are plenty of free online resources which provide you with the data required. TradingView happens to be my personal favourite. With just a little programming knowledge you can use TradingView to do the required manipulation to make COT analysis work with just about any currency pair or security. At the time of writing, these were the symbols for the relevant forex related COT data series.
| Currency | Speculative Long Positions | Speculative Short Positions |
| Euro | 099741_F_NCP_L | 099741_F_NCP_S |
| British pound | 096742_F_NCP_L | 096742_F_NCP_S |
| Japanese yen | 097741_F_NCP_L | 097741_F_NCP_S |
| Swiss franc | 092741_F_NCP_L | 092741_F_NCP_S |
| Canadian dollar | 090741_F_NCP_L | 090741_F_NCP_S |
| Australian dollar | 232741_F_NCP_L | 232741_F_NCP_S |
| New Zealand dollar | 112741_F_NCP_L | 112741_F_NCP_S |
Don’t Mix Up Base and Quote
COT data assumes that the currency in question is the base currency and the US dollar is the quote currency. For example, a net long position in Japanese yen futures translates into a net short in the standard USD/JPY quoting convention. The same logic extends to the Canadian dollar and Swiss franc, which are typically represented with the US dollar as the base currency. Make sure that you apply the right net positioning calculation for the quoting convection in question, otherwise you are drawing the completely wrong conclusions from the COT data.
The Basic COT Presentation
A lot of traders overlay COT net-positioning data over price to assist with interpreting whether positioning and price are both at extremes. For those who are unfamiliar with TradingView pine script programming, below is the pine script code of my custom indicator, which charts net speculative positions in EUR versus EUR/USD. Feel free to paste this code into the TradingView pine script editor for your own use. If you want to change the currency in question, just update the request.security function with the correct symbol.
//@version=5
// COT Non-Commercial Futures Position
indicator("EUR/USD Net Spec", overlay = true, scale=scale.left)
nonComLong = request.security("099741_F_NCP_L", "W",close)
nonComShort = request.security("099741_F_NCP_S", "W",close)
nonComNet = nonComLong - nonComShort
plot(nonComNet)
As mentioned prior, for currencies where the US dollar is the base, you will want to adjust the nonComNet expression to reflect nonComShort - nonComLong due to quoting conventions. The example below displays the code for the USD/CAD indicator, but with the correct symbols would work with USD/JPY and USD/CHF.
//@version=5
// COT Non-Commercial Futures Position
indicator("USD/CAD Net Spec", overlay = true, scale=scale.left)
nonComLong = request.security("090741_F_NCP_L", "W",close)
nonComShort = request.security("090741_F_NCP_S", "W",close)
nonComNet = nonComShort - nonComLong
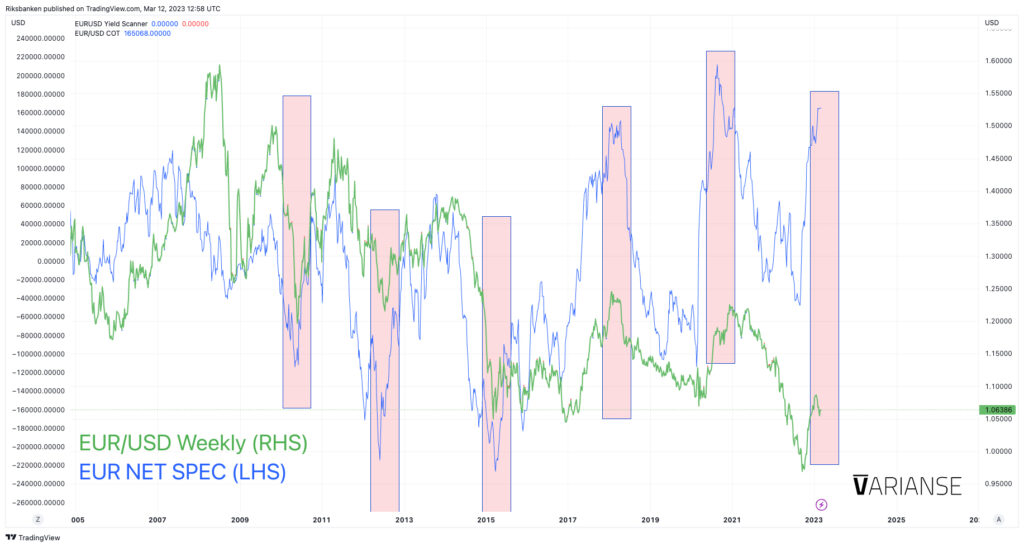
plot(nonComNet)Basic Is Not Perfect
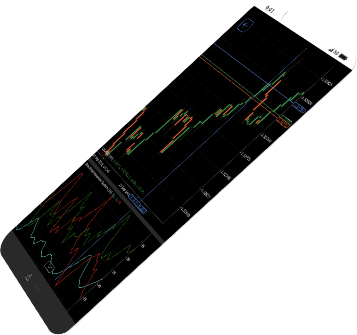
The basic presentation of the COT, however, is far from perfect. Looking at the EUR/USD weekly chart overlaid with raw net positioning below, it is a bit hard to tell when positioning is really overextended. Also, the times when extended positioning and trend reversal coincide is not always clear. I’ve done my best to mark those locations on the chart, but they aren’t always obvious. Issues with the basic presentation stem partly from shifts in the overall number of participants in the futures market at any given point in time, combined with what has been a larger number of futures participants since records began.
Adjusted Net Positioning
One of the tricks that I learned over the years to circumvent these issues is to calculate net positioning as a share of overall positioning using the formula below:
net positioning share = (long positions - short positions) / (long positions + short positions)
Below is the code for the EUR/USD net-positioning share indicator for TradingView:
/@version=5
// COT Non-Commercial Futures Position
indicator("EUR/USD COT %", format=format.percent, overlay = true, scale = scale.left)
nonComLong = request.security("099741_F_NCP_L", "W",close)
nonComShort = request.security("099741_F_NCP_S", "W",close)
nonComTotal = nonComLong + nonComShort
nonComNetShare = (nonComLong - nonComShort) / nonComTotal
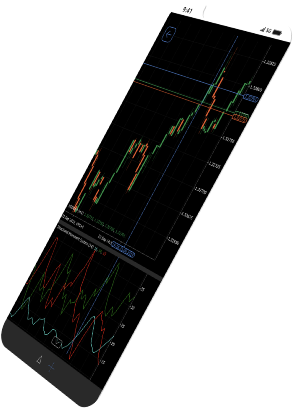
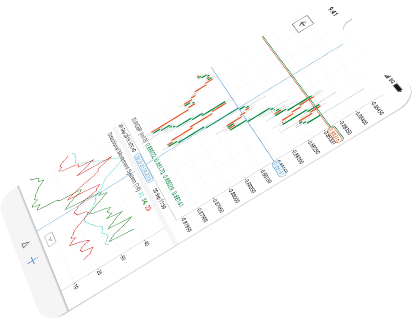
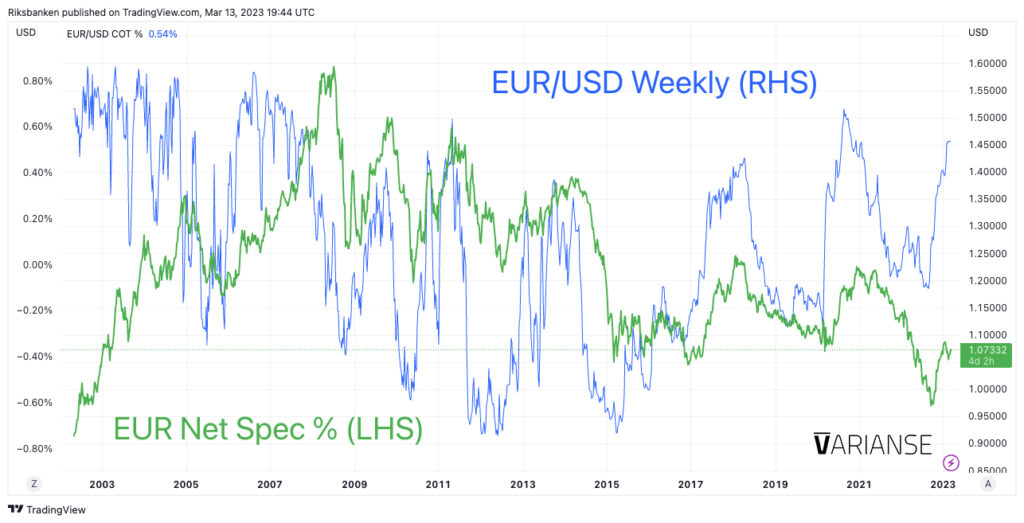
plot(nonComNetShare, "Net Positioning")When applied to a chart, the net positioning share calculation definitely makes it easier to spot extremes in the COT net positions. Below is an example, again using EUR/USD in order to allow for consistent comparison.
Further Adjustments Optional
I personally like to keep my analysis of the COT simple. Nevertheless, plenty more analysis can be done on both the COT and more specifically the net speculative positions reported. Some like to look at the long-term average of net-speculative positions relative to the current level. Others even look at moving averages, cumulative averages, z-scores, and a whole host of other types of statistical analysis. I’ve even seen traders aggregate positioning data to form a broader view of the US dollar. Once you get to grips with using the COT, people usually adopt their own type of analysis that suits them best.
Alone the COT Is Not Enough
Were someone just to trade off of what appears to be extended positioning, they would lose a lot of money. Markets of all kinds can trend for long periods of time and still look overextended according to the COT data. Just remember, COT acts more as a guide than quantitative solution, when trying to suss out a potential change in trend. When I use COT I look to see when both sentiment and positioning are extreme. When everyone, including the newspaper, is talking up the prospects of a currency sentiment may be at an extreme. Also, when good/bad news, that would otherwise cause a currency to move, fails to push it higher/lower may act as another barometer for sentiment. I personally recommend a mix of sentiment, COT positioning, and technical indications of a trend reversal.
Final Thoughts
The Commitments of Traders report has proven to be invaluable in terms of my trading. Together with an understanding of market sentiment and price, the Commitments of Traders report can help any trader spot potentially big changes in trends. Hopefully, some of the tips and tricks I’ve outlined will make it easier for you to adopt positioning analysis into your trading. Just remember, that Commitments of Traders report should never be used on its own. Markets can continue to trend even if positioning looks extreme. I wish you the best of luck with your trading.