
In the world of trading, it’s usually not the technical indicators that cause the trouble, but other factors. Traders often misuse them.
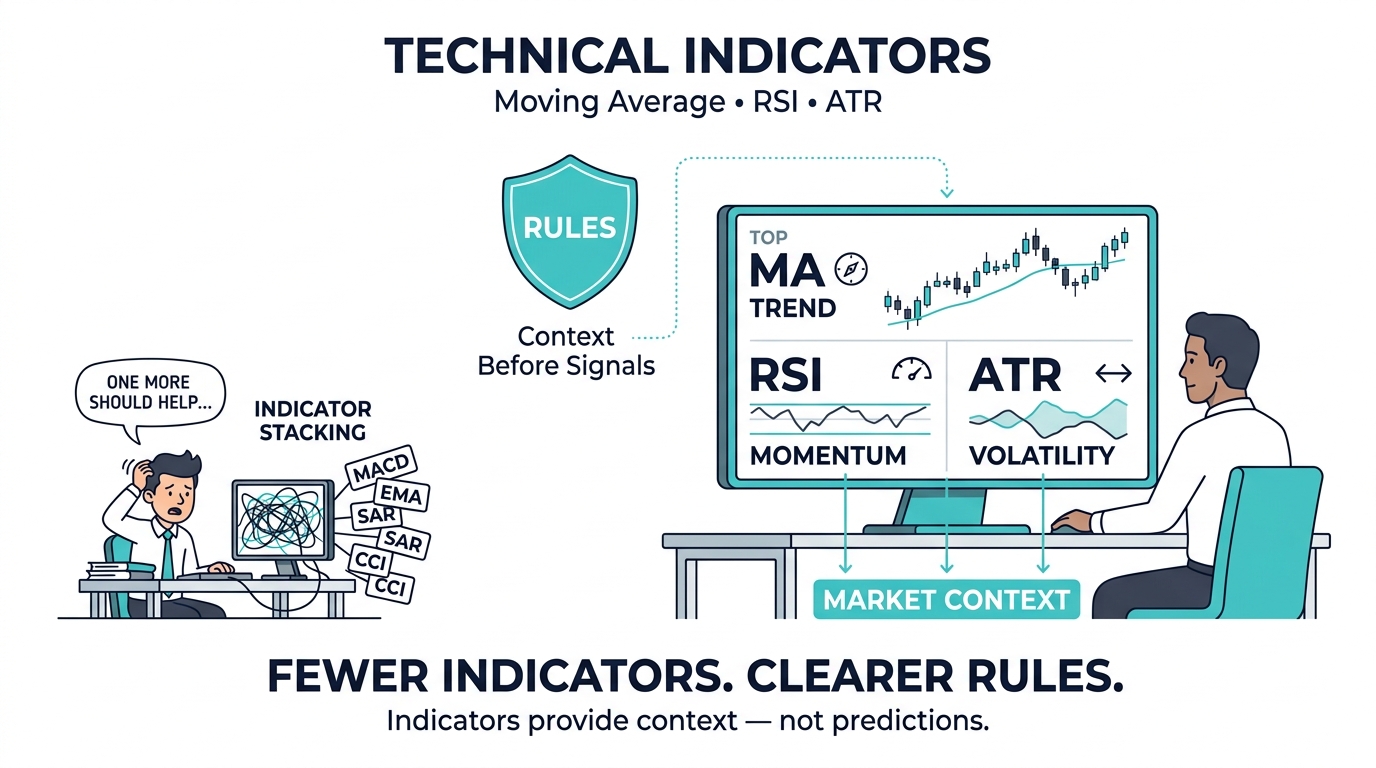
Newbie traders often pile on indicators, chase signals, and get emotional over every little move on the charts. Pro traders do the opposite. They rely on a few key signals when using a rule-based trading strategy and always consider the market situation.
This lesson shows you how to use Moving Averages, RSI, and the ATR indicator as decision-support tools, not as crystal-ball predictors. You will learn how structured moving-average trading, a disciplined RSI indicator strategy, and volatility control using the ATR indicator can improve consistency in Forex and CFD trading.
Why Technical Indicators Matter in Financial Markets
The technical indicators rely on the use of mathematical computations on market data including past prices and trading volumes in some cases.
They assist traders to analyze various aspects of market activity like price movement, momentum and volatility.
In the context of Forex or Contract for Difference trading, indicators may enable traders to develop a systematic method of analysis but not free from risk. Their usefulness is contingent on how they are used.
Common Mistakes When Using Technical Indicators
Technical indicators may confuse traders if they apply too many similar indicators or try to interpret individual signals without taking into account overall market context.
Common mistakes include:
- Combining multiple indicators that provide overlapping information.
- Treating every indicator signal as an automatic entry or exit opportunity.
- Frequently changing indicator settings after individual losses.
- Ignoring market structure, volatility and risk management.
- Assuming that adding more indicators will necessarily improve analysis.
A systematic approach can help to interpret signals of indicators consistently, but systematic strategies may still result in false signals and losses.
Moving Averages: Understanding Trend Direction
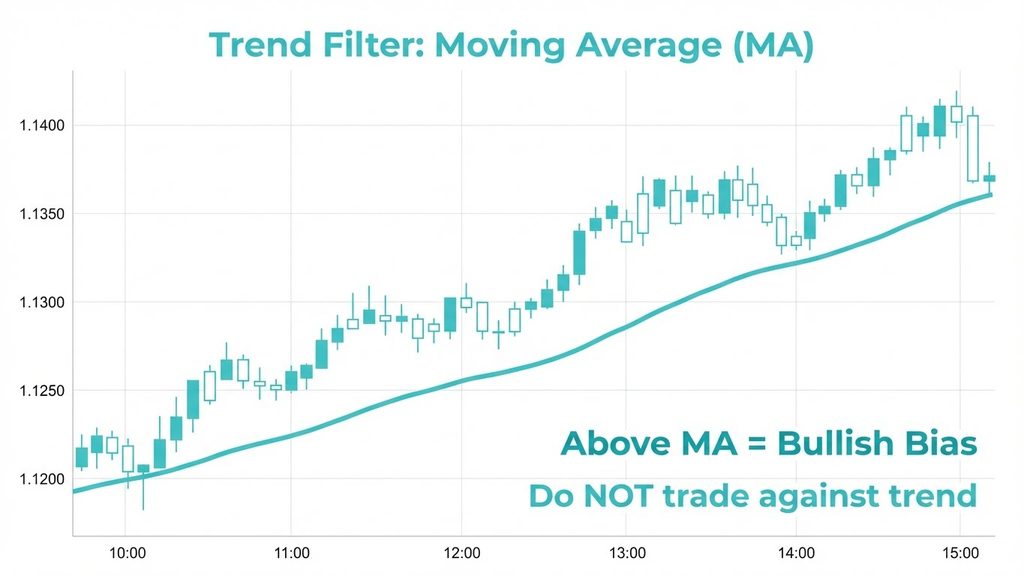
The moving average is an averaging tool that uses price data for a certain number of periods and helps the trader see the larger picture about price movement.
There are two common kinds: simple moving average (SMA), which is an average price for a certain period; and exponential moving average (EMA), which gives more importance to the most recent prices.
The moving average can be useful in finding out potential trends, but it works on price data and sometimes gives wrong information if there are no trends at all.
How Traders Can Interpret Moving Averages
In a rule-based trading strategy, moving averages help traders develop their strategies.
- Price consistently above a moving average may suggest upward momentum.
- Price consistently below a moving average may suggest downward momentum.
- A relatively flat moving average may indicate limited directional movement.
- Frequent price crossings may suggest a ranging market or unstable trend conditions.
Moving Average Rules Summary
- When the price stays above the moving average, it’s usually a good sign for bulls.
- When the price remains below it, bearish bias dominates.
- When the moving average is flat, steer clear of trend-based systems.
- This method draws a clear line between smart, calculated trades and winging it based on feelings.
RSI Indicator Strategy: Understanding Market Momentum
The Relative Strength Index (RSI) is a momentum oscillator that measures the magnitude of recent price gains relative to recent price losses.
RSI values range from 0 to 100.
Traditionally, readings above 70 are described as overbought, while readings below 30 are described as oversold.
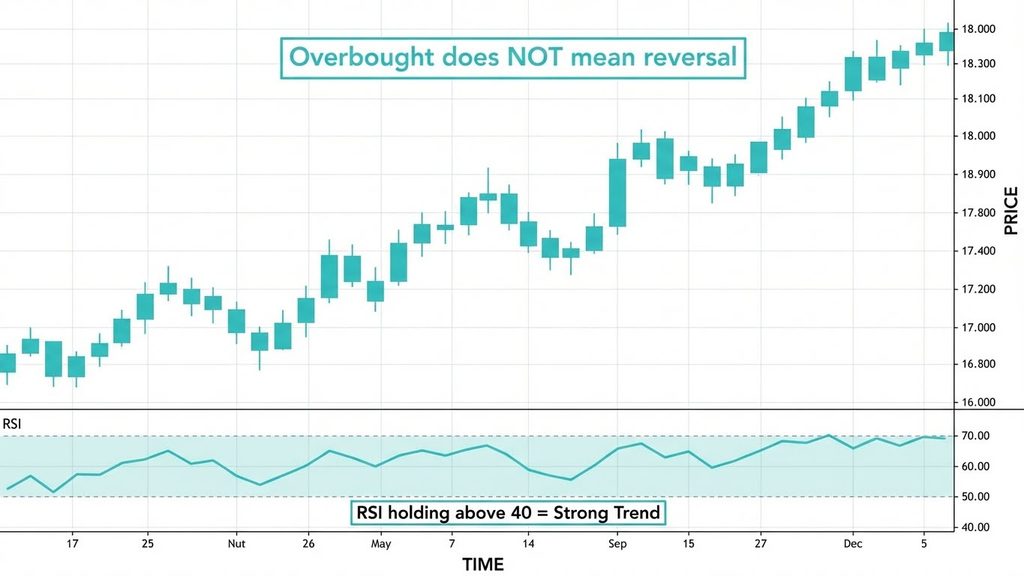
However, these conditions do not automatically indicate that a price reversal is approaching. During strong trends, RSI may remain above 70 or below 30 for extended periods.
RSI Indicator Strategy
The Relative Strength Index (RSI) measures momentum, not future price direction.
A strong RSI indicator strategy does not treat overbought or oversold readings as automatic reversal signals. Strong trends can stay overbought or oversold for quite a while
How Traders Can Interpret RSI
A disciplined RSI indicator strategy uses RSI to confirm strength in trends and identify weakening momentum not predict turning points blindly.
In trending markets:
- Above 70: May indicate strong upward momentum or overbought conditions.
- Below 30: May indicate strong downward momentum or oversold conditions.
- Above 50: Often suggests that recent upward price movements have been stronger than downward movements.
- Below 50: Often suggests that recent downward price movements have been stronger than upward movements.
Some traders look at the 40–90 range in an up-trend and 10–60 range in a down-trend, though this is a situation-specific approach and not a hard-and-fast rule.
Even if RSI Divergence signals changes in momentum, it does not necessarily imply a reversal.
The indicator should therefore be considered in conjunction with price action and risk management issues.
RSI Rules Summary
When momentum starts weakening or diverging, it may signal exhaustion, but market context always matters more than the indicator alone. A structured RSI indicator strategy integrates regime and structure before execution.
ATR Indicator: Measuring Volatility and Supporting Risk Management
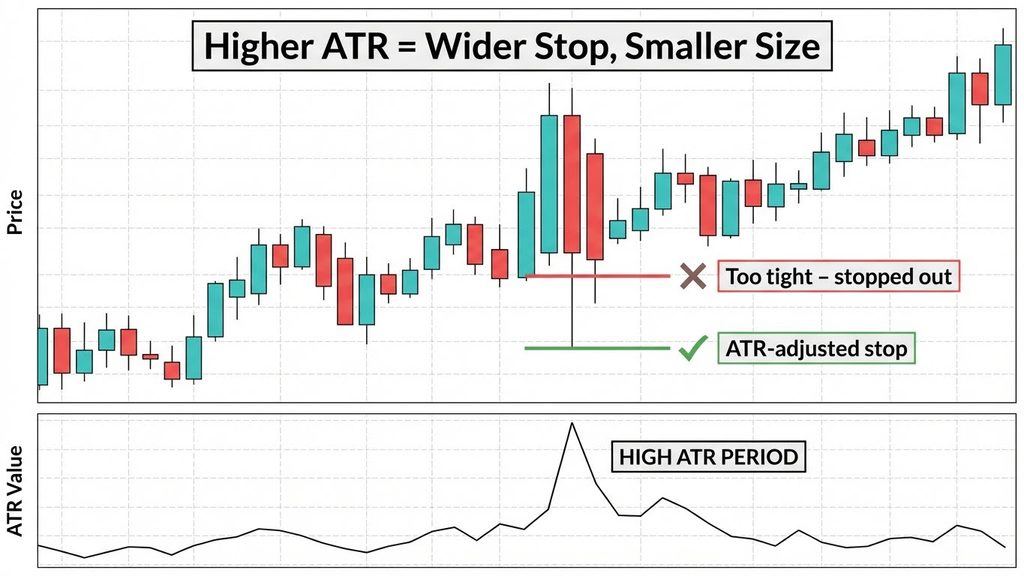
Average True Range (ATR) is an indicator that is used to measure the average range of movement of prices over a chosen period, taking into account the gap created between sessions.
The Average True Range is a volatility indicator, meaning that it does not provide direction of future prices' movement, but rather the size of that movement.
High ATR is normally associated with high volatility, low ATR with low volatility.
How Traders Can Use ATR
- Assess whether recent price movements have become more or less volatile.
- Consider volatility when evaluating potential stop-loss distances.
- Adjust position sizing according to predefined risk limits.
- Compare current volatility with historical conditions for the same instrument.
For example, some trading approaches use a multiple of ATR when calculating a potential stop-loss distance.
However, ATR does not determine an appropriate stop-loss automatically. Wider stops may require smaller position sizes to maintain the same planned monetary risk.
Stop-loss orders can also experience slippage, particularly during volatile market conditions.
ATR should therefore be used as a volatility reference rather than a guarantee of risk control.
ATR Rules Summary
High ATR means you’re taking bigger stops and going with smaller positions
Low ATR = tighter stops and controlled exposure.
Incorporating the ATR indicator into a rule-based trading strategy helps maintain consistency and reduce emotional reactions.
Indicators With Rules vs. Indicator-Based Trading
Professional traders depend on a handful of tools with straightforward guidelines. Retail traders sometimes just react to charts and indicators, piling on more tools when they lose money and looking for signs that something’s right instead of clear-cut reasons
- A true rule-based trading strategy defines:
- When an indicator is valid
- When it should be ignored
- How risk is calculated
- When no trade should be taken
- Indicators should support decisions, not replace thinking.
How to Use Technical Indicators in Forex and CFD Trading
All these indicators may be combined to use since they evaluate different market behaviors.
- Moving averages: Help identify potential trend direction.
- RSI: Provides information about recent price momentum.
- ATR: Measures recent price volatility.
For example, a trader may use a moving average to assess the broader trend, RSI to examine momentum and ATR to understand the size of recent price fluctuations.
However, combining indicators does not automatically improve trading performance. When signals conflict, traders should reassess the market context rather than forcing a trading decision.
Any indicator-based approach should also include predefined risk limits and appropriate position sizing.
Practical Example: Combining Moving Averages, RSI and ATR
Consider a hypothetical EUR/USD chart where price is trading above its 50-period moving average.
A trader might interpret this as an indication of upward price momentum.
If RSI is above 50, it may provide additional information about recent buying momentum, while ATR can help the trader assess the size of recent price fluctuations.
However, these observations do not establish that EUR/USD will continue rising.
The trader would still need to evaluate the broader market context, potential losses and predefined risk limits before considering a position.
This example illustrates how different indicators can contribute to analysis without being treated as guaranteed trading signals.
Conclusion: Technical Indicators Support Decisions, Not Predictions
Moving averages, RSI and ATR present various views on market performance.
With moving averages, one is able to look into the direction of price while RSI shows momentum while ATR shows information regarding volatility.
It is possible to learn the difference between these indicators to be able to trade using the technical indicators properly.
Nonetheless, there are no guarantees of success through the use of technical analysis.