
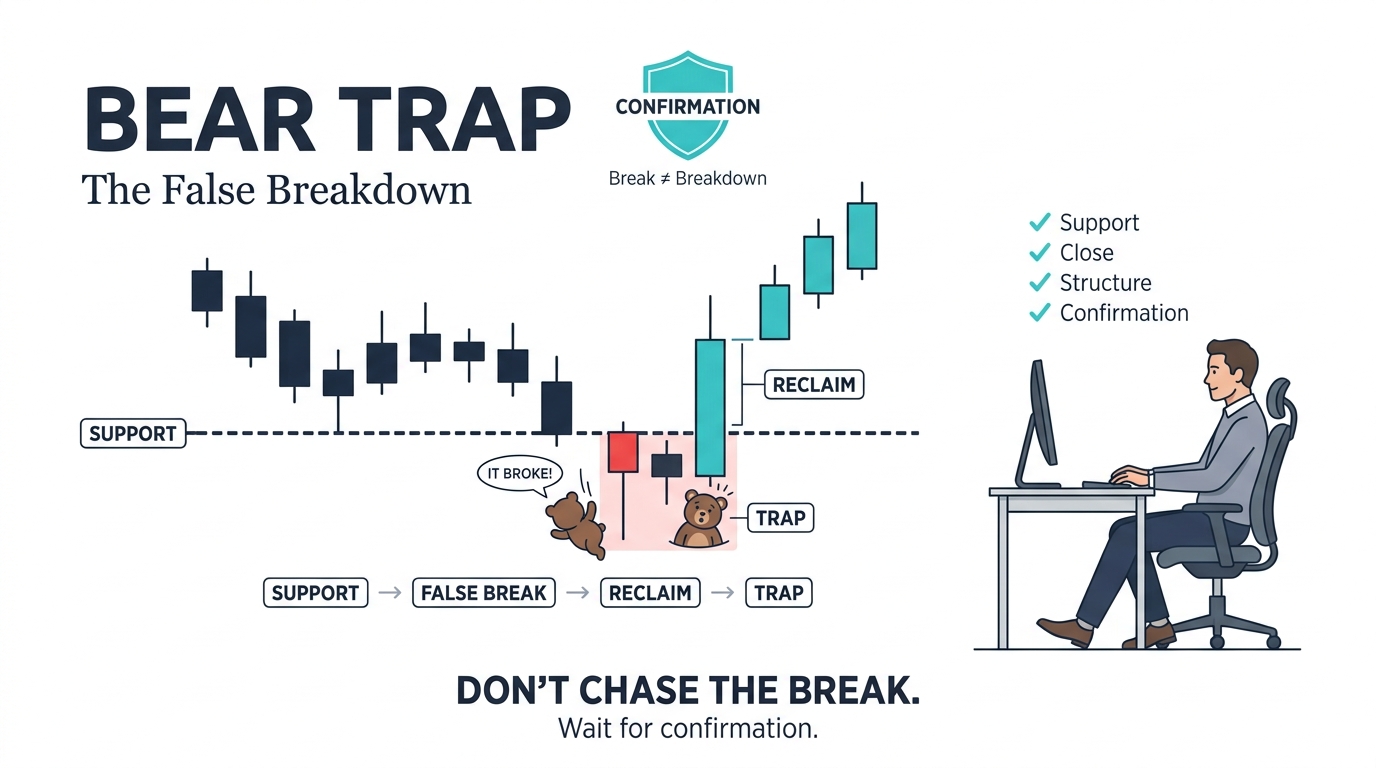
A bear trap in Forex and CFD trading occurs when price breaks below a support level, attracting sellers, before reversing upwards and invalidating the apparent bearish move.
This type of reversal will pose a serious problem for those traders that trade during breakdown as there may be losses that are unforeseen especially if leverage was used.
So how do traders determine the difference between a bear trap and a breakdown?
The solution to the problem is definitely not to trade faster but rather understand the market structure, support and resistance, price confirmation and risk management to make it easier.
Here we describe the formation of a bear trap and the possible look of a bear trap in trading chart.
What Is a Bear Trap in Trading?
When the price dips below a crucial support level, it signals traders that the market’s downward slide has started, but then it snaps back up in a sharp support reclaim, making those who sold at the bottom wish they hadn’t
Forex bear traps and CFD bear traps are common across markets, including Forex, stocks, crypto, and leveraged CFD trading, where liquidity and stop levels are easier to identify.
This behavior ties in with a common misunderstanding of market structure, which you can read about in Market Structure Explained: HH, HL, LH & LL.
Bear Trap vs Real Breakdown: Understanding the Key Difference
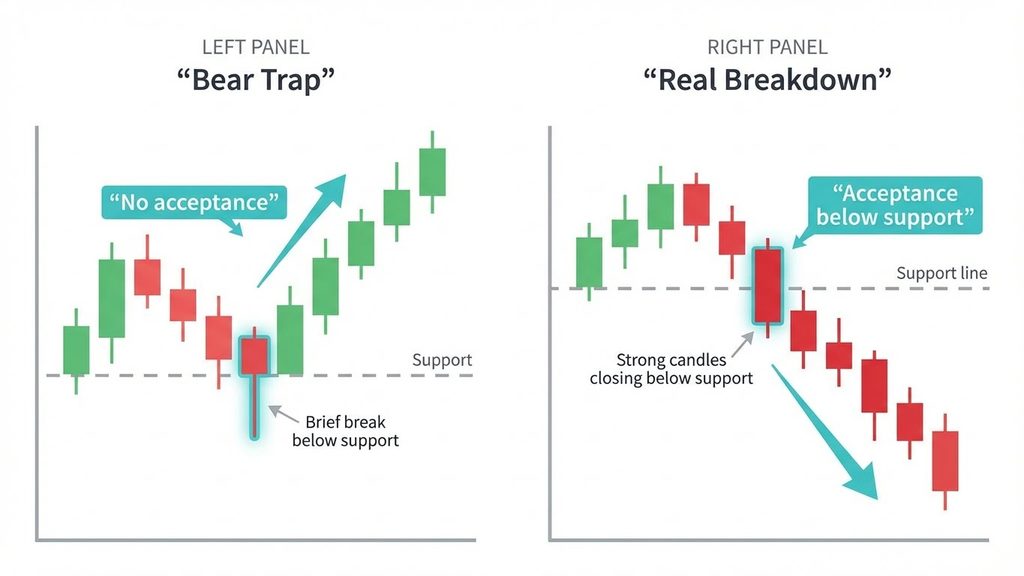
A breakdown is only valid when the price accepts trading below support. A bear trap occurs when the price dips below support for a short while but doesn’t stay there; this is known as a false breakdown
In a genuine breakdown, candles hold below the level, volume expands with clear confirmation, and the market begins forming lower highs and lower lows
In a bear trap, price quickly reclaims support, volume fades or becomes inconsistent, and the broader structure does not support a bearish trend
Keeping this difference in mind prevents traders from jumping in on price changes without verifying they're legit.
How Bear Traps Look on Real Charts
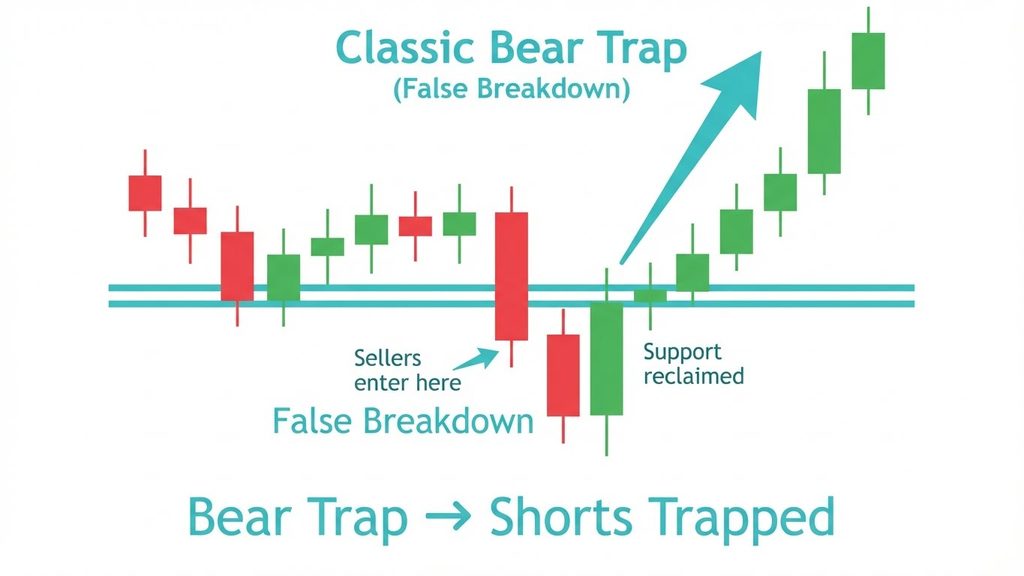
When traders pay attention to the closing prices, the overall structure, and the context, they can spot the predictable patterns in how bear traps work
Example 1 — Support Break and Immediate Reclaim
Price breaks below support, attracting aggressive sellers.
The candle then quickly reclaims the level, invalidating the bearish breakdown. Prices often move sharply upward as short sellers exit positions and stop-loss orders are triggered.
This is just one case of a false breakdown pattern. Nevertheless, it would be wrong to conclude that prices will keep on rising because more action needs to be taken to gauge the structure of the market.
Example 2 - Stop Hunt Wick Below Support
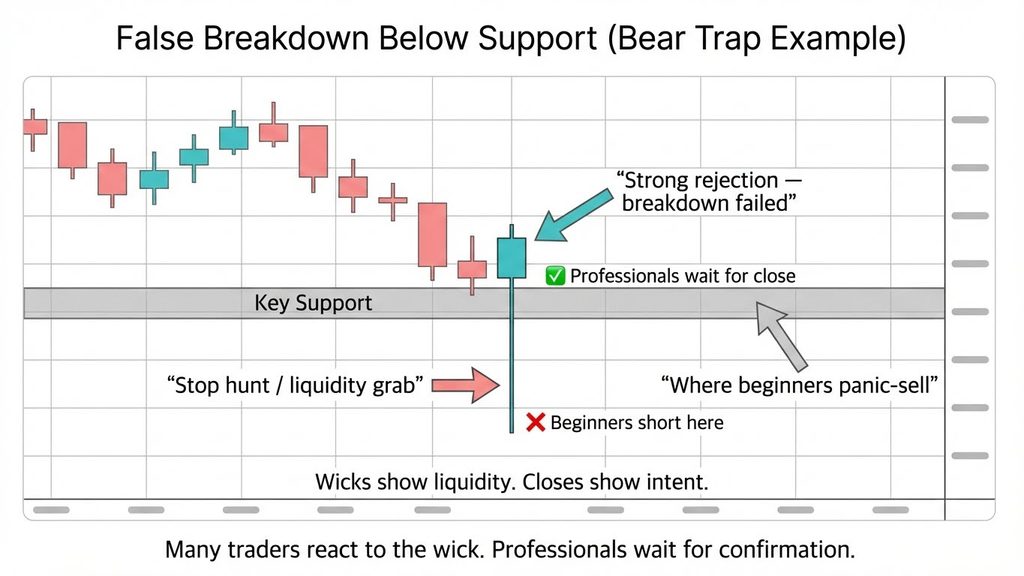
Price momentarily falls below the level of a known support level, then rallies back up above it.
Such a movement can act as an indicator of stop-losses that have been placed below support levels or attract buyers who think that prices will fall even further.
The rally that follows implies that the sellers could not manage to sustain their selling pressure at that moment.
While traders do use this pattern as a sign of a liquidity grab or stop hunt, there is no way for the trader to determine the intentions of the market through the price action alone.
Example 3 — Breakdown, Retest, and Failure
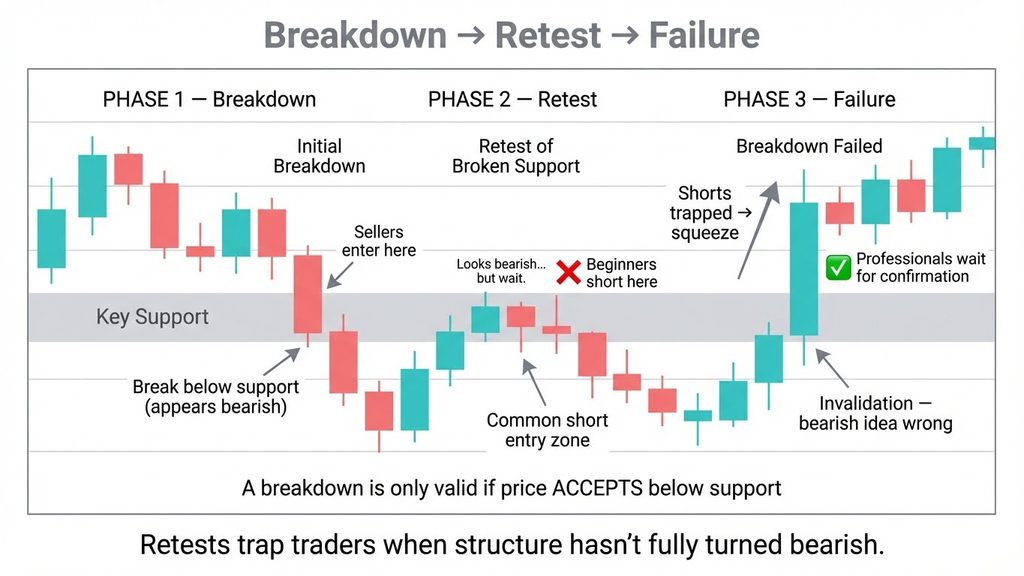
The price falls below the support level, then tests the violated level. In this case, the price does not fall but instead rises back above the violated level, which indicates that the original bearish impulse might be false.
In this situation, the short covering can push prices up. However, there is no certainty about the short squeeze.
Signs of volume and timing that reveal bear traps
Experienced traders know that false breakdowns leave clues.
Volume Behaviour
Even though volume can offer more information in terms of breakdown analysis, it cannot be regarded as a definite indicator.
When it comes to the spot Forex market, many trading platforms use tick volume instead of overall market trading volume. That is why readings may vary from one broker to another and from one data provider to another.
While the combination of the breakdown signal with increased trading volume can draw the attention of traders, high trading volume is no guarantee that the breakdown will continue. A false breakdown can occur in periods of both high and low trading activity.
Timeframe Alignment
Short-term breakdowns are less meaningful if the higher-timeframe structure remains bullish.
Many bear traps occur when traders ignore the broader market context — a concept also discussed in Trendlines, Channels & Market Context.
Bear Traps in Forex and CFD Trading (Why They Hurt More)
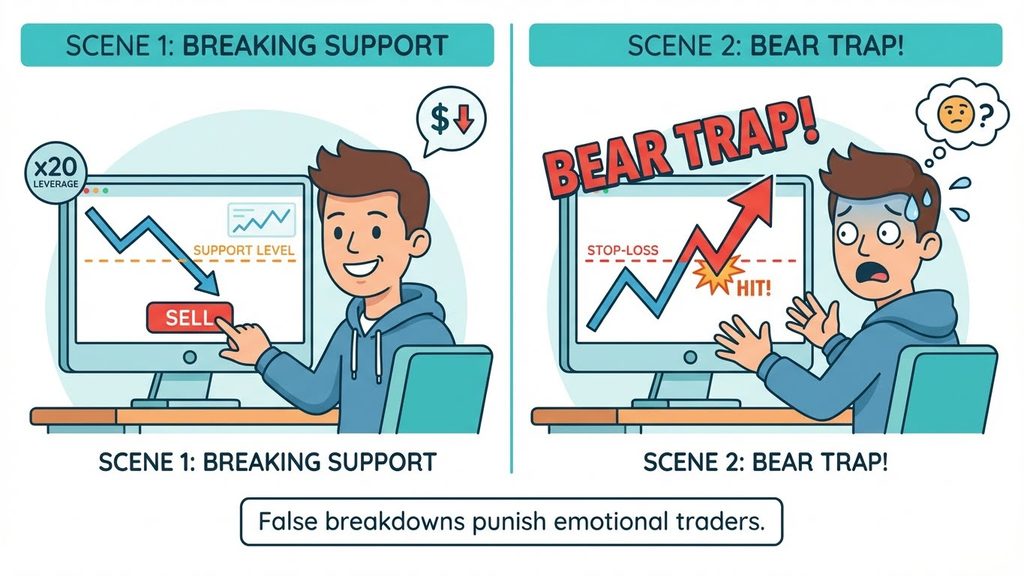
In leveraged markets, even small price reversals can create large losses.
Stops trigger faster, pressure builds quickly, and emotional decision-making often follows.
That is why CFD bear traps often hurt traders who overleverage, enter without confirmation, or refuse to exit invalidated trades.
Risk control ideas we’re talking about are in the books Risk Management Fundamentals for Traders and Position Sizing Explained Step-by-Step.
For safe practice, keep an eye on these patterns in a simulated setting through the VARIANSE trading account page
Bear traps can create additional risks in leveraged CFD trading, where sudden price reversals may amplify losses. The Financial Conduct Authority (FCA) provides guidance on the risks associated with CFDs, including leverage and the potential for significant financial losses. Understanding these risks is an important part of managing exposure during volatile market conditions.
Bear Trap vs Bull Trap (Key Comparison)
A bear trap is a deceptive false breakdown that snares sellers and flips prices upward
A bull trap is a false breakout that traps buyers before prices fall.
Both traps exploit impatience, emotional reactions, and premature entries.
This concept ties right into the whole deal with breaking down structures and shifts in Market Structure.
How to Reduce Bear Trap Risk: 5 Practical Trading Rules
Bear traps are not avoidable; however, the traders can apply good risk management techniques to avoid unnecessary risks.
Rule 1 — Avoid Reacting to Every Initial Breakdown
Just because prices break down below support doesn't mean you should conclude that a bearish market is present. You can try to see what happens next before making an assessment.
Rule 2 — Evaluate Candlestick Closes and Market Context
A close below support would reinforce the bearish view, but a close back above the support line might signal that support was rejected. In neither case is there a guarantee of what will happen next in the markets.
Rule 3 — Define Invalidation Clearly
If price bounces back and holds after a support reclaim, the bearish theory doesn’t hold up. Leaving is about self-control, not giving up
Rule 3 — Define Trade Invalidation Before Entering
Determine the price levels at which your initial trading plan would be threatened. For instance, a price level rising above a broken support level is likely to invalidate your bearish trade idea.
Rule 4 — Manage Position Size and Leverage
Take position sizing in line with your risk profile and stop-loss distance. While the stop-loss order will help you manage risk, there is no assurance that your order will be executed at the right price.
Emotional escalation gets a spotlight in Trader Psychology: Fear, FOMO & Revenge Trading.
Rule 5 — Avoid Revenge Trading
A losing trade is no reason to add risk or take another position without thought. Consider the set-up again, stick to your trading plan and make sure that you’re not acting out of frustration.
Conclusion: Understanding Bear Traps and Managing Risk
The example of bear traps will explain why the break below the support level may not result in a trend reversal down.
Through understanding the nature of market structure, the reaction to the price movements and timing aspects, and signals that could confirm whether it is a bear trap or a breakdown, traders may distinguish between these two situations.
Nevertheless, there is no way to detect all bear traps beforehand.
The most important message here is to combine technical analysis with reasonable position size, risk management, and discipline.