
What is a price chart? A price chart shows how an asset's price has moved over time, turning raw market data into a visual representation of price movements.
For beginners, understanding price charts is essential for recognising market trends, observing price fluctuations and interpreting market behaviour. A price chart helps traders and investors analyse historical market movements, but it cannot guarantee what will happen next.
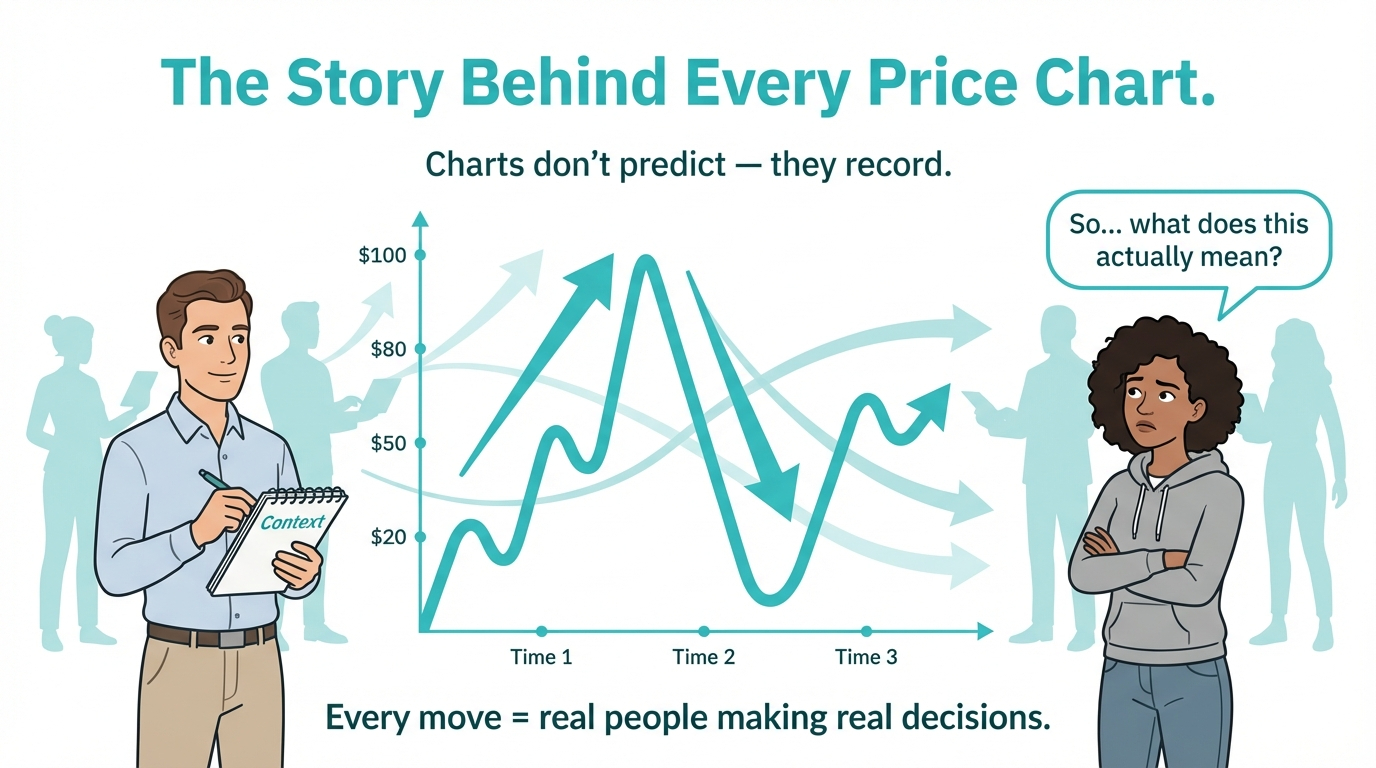
A price chart can't tell us what will happen next. It records history and what's happening now. Its role is to help traders and investors observe structure, movement, and reaction, not to promise certainty. Grasping the real meaning behind a chart is key to developing a clearer understanding of trading.
What Does a Price Chart Represent
A price chart displays how the price of a financial instrument changes over a selected period.
Depending on the market and data provider, charts may use executed transaction prices, bid prices, ask prices or other quoted market data.
These movements reflect market conditions influenced by factors such as supply and demand, liquidity, economic developments and participant activity.
This shows how markets work, through the interaction of market participants, and it's all about supply, demand, and people getting involved, not just what people think or guess. You can read more about it in the 🔗 Financial Market Foundations.
Why Is a Price Chart Different from the Market Itself
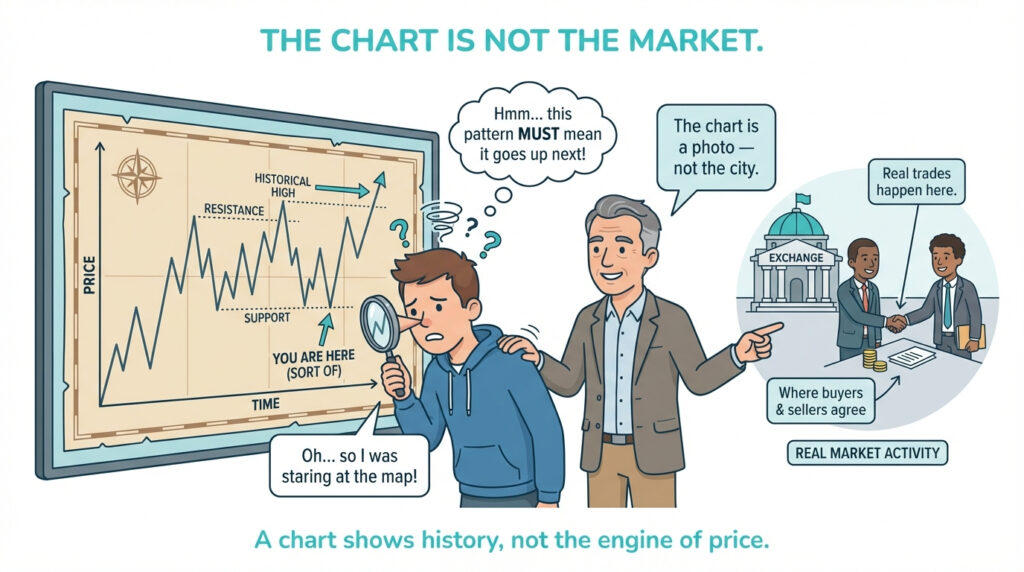
A price chart represents market data, but it does not show every factor influencing trading activity. Financial markets operate through the interaction of buyers, sellers, brokers, liquidity providers and execution systems. A chart displays selected price information from these activities, allowing traders to observe movements without revealing every underlying transaction or market participant.
This difference is key, since many newbies view charts as signals rather than as actual historical records. Trade Mechanics & Execution Basics lays out the intricacies of this subject, demonstrating how prices are determined as a process rather than by market activity and price formation.
Why Price Charts Exist
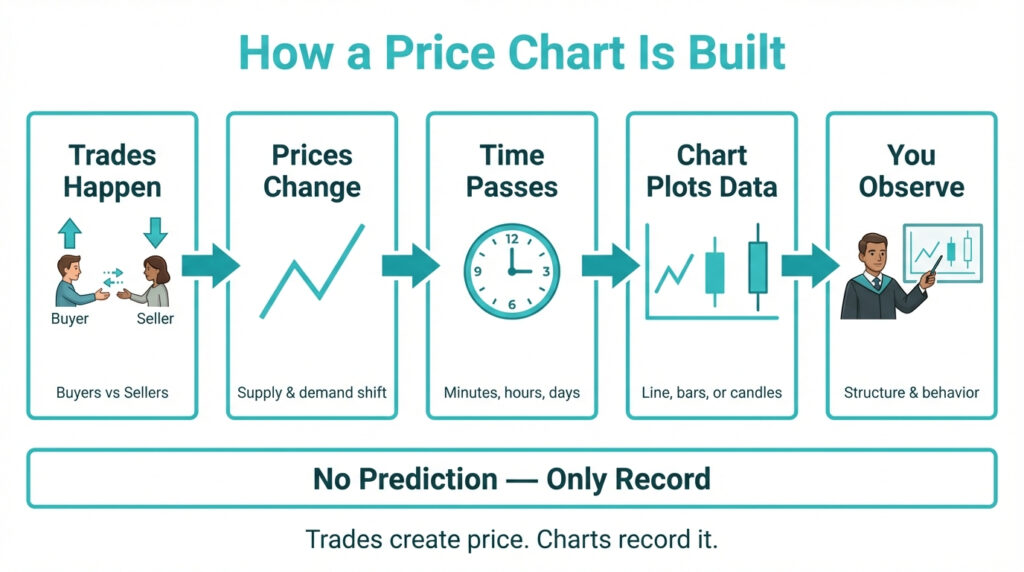
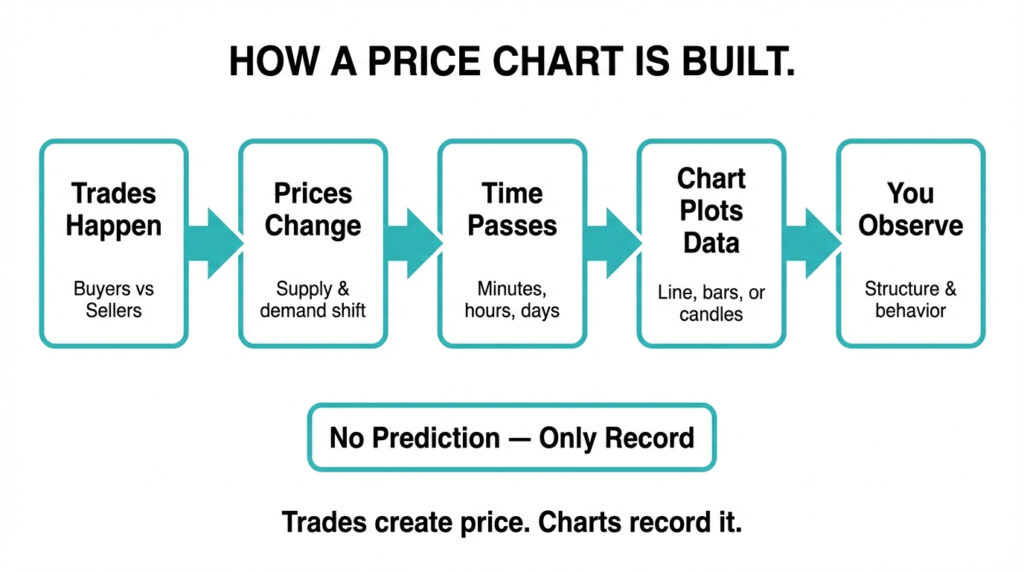
Market data can be difficult to interpret without visualisation without charts. Charts turn many trades into a picture that makes sense to our brains.
They make things easier to understand. Instead of just individual price observations or transactions, you notice a straightforward path that shows how the price moved when things changed.
The Main Types of Price Charts
Price charts usually appear in three main formats.
Line Charts
A line chart links the closing prices, making the overall trend easy to spot. It is useful for gaining a broad overview without delving into specific details.
Bar Charts
A bar chart displays the open, high, low, and close prices. It gives extra details on how much things can fluctuate and how they spread between highs and lows.
Candlestick Charts
Candlestick charts give you the same info as bars, but they really make it easy to see the ups and downs in momentum and pressure. People often use them because they get the point across fast.
Timeframes and What They Mean
A chart timeframe determines the period represented by each price observation, bar or candlestick. Common timeframes include one minute, five minutes, one hour, one day and one week.
Shorter timeframes provide more detailed information about recent price movements but may contain greater short-term market noise. Longer timeframes offer a broader view of price behaviour and may help traders identify larger trends.
Neither approach guarantees better trading results. The most suitable timeframe depends on the trader's objectives, strategy and risk management approach.
What Can Price Charts Tell Us About Market Behaviou
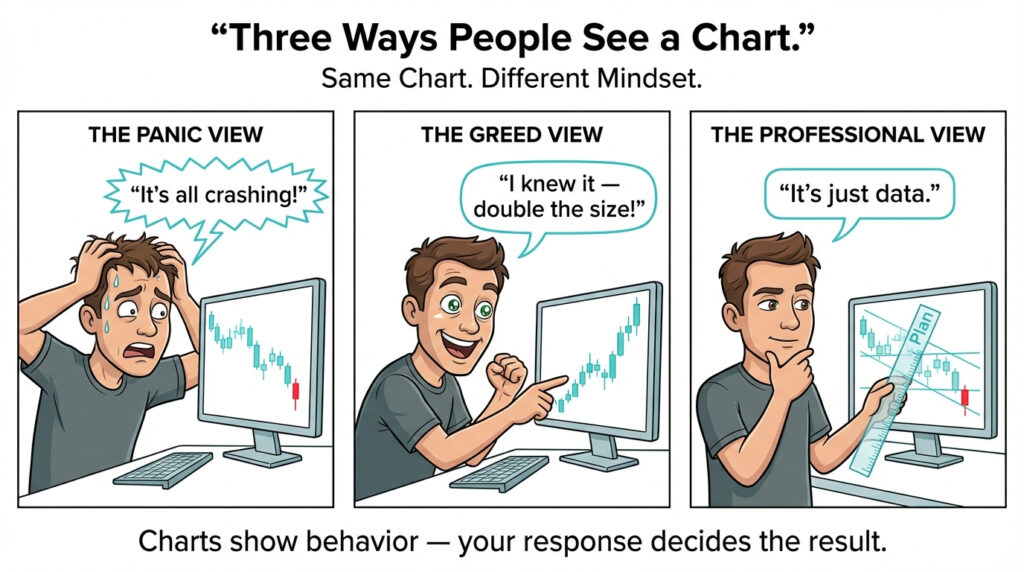
Price charts help traders observe patterns in historical market movements. These may include trends, periods of consolidation, increased volatility and changes in price momentum. However, charts cannot reveal every reason behind a price movement or reliably predict what will happen next.
Traders should therefore use chart analysis alongside appropriate risk management and an understanding of broader market conditions.
How Do Price Charts Help Traders Understand Risk
Charts show volatility clearly and visually. Wide swings indicate significant unpredictability. Relatively smooth price movements may indicate lower observed volatility.
This bond echoes the essence of What Does Investment Risk Really Mean?, where the market's unpredictability is highlighted as its main characteristic.
Where Price Charts Exist
Price charts are available through online trading platforms, financial websites and market-data services. Trading platforms often combine charts with tools for monitoring market prices, placing orders and managing open positions.
However, charting tools do not necessarily provide direct trading functionality.
Understanding how online trading platforms work helps beginners distinguish between analysing market information and executing trades.
In the article How Online Trading Platforms Work?, it's mentioned that charts support analysis but do not make trading decisions
Is a Price Chart the Same as a Trading Strategy
A price chart provides information about market movements, but it does not automatically tell traders when to buy or sell. A trading strategy involves defined rules for identifying opportunities, entering and exiting positions, managing risk and evaluating results.
Charts may support these decisions by providing historical price information and technical analysis tools. However, no chart pattern or technical indicator guarantees a profitable outcome.
Why Charts Trigger Emotions
Charts are updated live. Seeing prices fluctuate stirs up both fear and excitement. This emotional reaction is outlined in the article Why Emotions Affect Investment Decisions?, where it's clear that immediate feedback has a stronger impact on actions than pure reason.
Learning to Read Charts Safely
The best way to develop chart-reading skills is by just looking at them without worrying about money.
You've got a safe space on the VARIANSE trading account page for newbies to check out how prices are moving, spreads, and volatility without putting any of their own cash on the line.
Price Charts in Structured Education
Beginners can develop chart-reading skills by observing market movements and comparing different chart types and timeframes.
Where available, demo trading accounts allow users to explore price charts and practise trading with simulated funds without risking real capital.
This system is built piece by piece on the VARIANSE academy education page, turning charts into clear guides rather than sources of confusion.
Conclusion: What Is a Price Chart?
Understanding what a price chart is helps beginners interpret how financial market prices change over time.
Price charts organise historical market data into visual formats, such as line, bar and candlestick charts, making it easier to observe trends, volatility and price movements.
However, charts cannot guarantee future price movements or explain every factor influencing financial markets.
By learning how different chart types and timeframes work, traders can develop stronger analytical skills and make more informed decisions. Ultimately, price charts are valuable tools for market analysis, but they should be used alongside risk management, trading discipline and a broader understanding of financial markets.