
Although candlestick charts are very common in financial markets, many new traders fail to comprehend the meaning of a single candlestick.
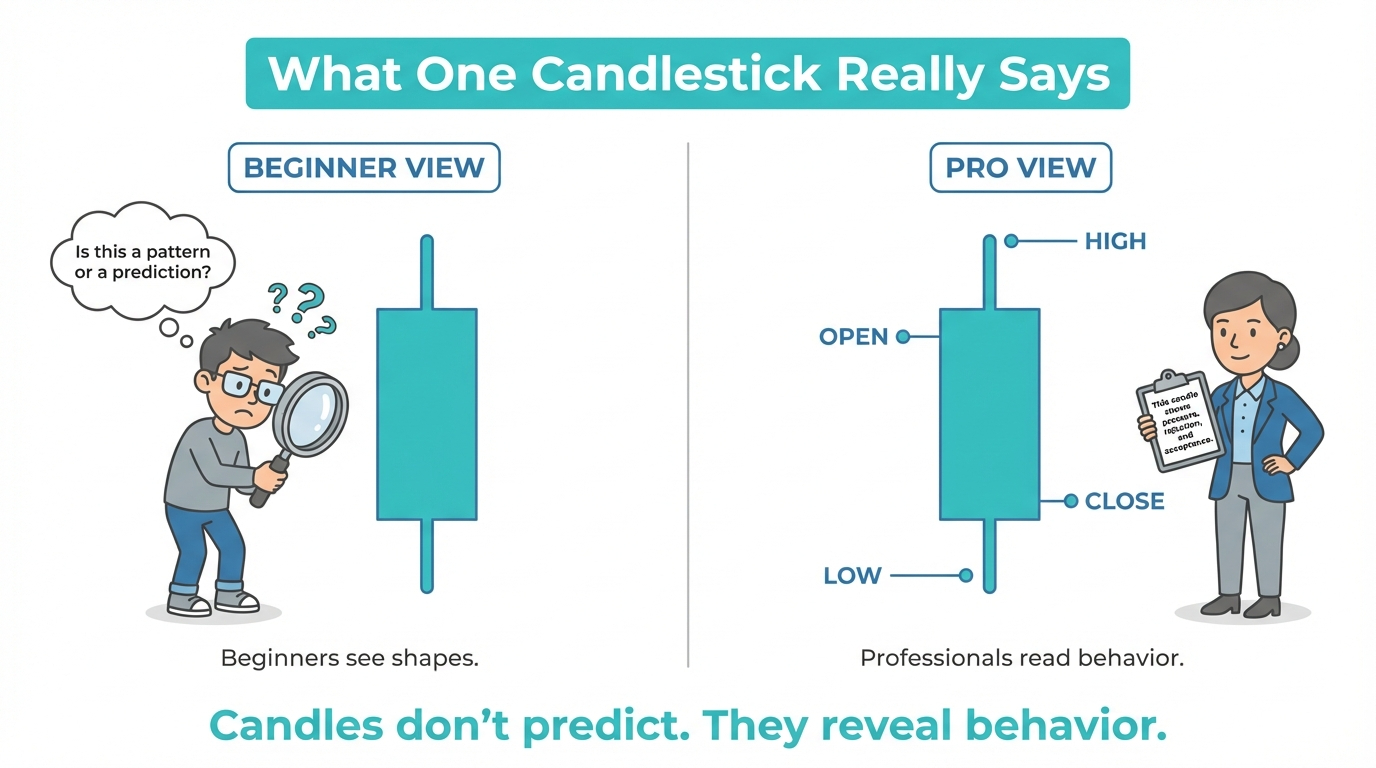
A candlestick is a graphic representation of price data during a certain period, representing the opening price, the highest price reached, the lowest price achieved, and the closing price.
It is important to know the meanings of these four factors since they allow interpreting past prices without using only pattern recognition techniques.
Nevertheless, candlesticks cannot tell us the reasons for price movements or future price changes. Here we will introduce you to the anatomy of a candlestick.
This understanding builds directly on the structural concepts explained in Financial Market Foundations, where price movements reflect participation, liquidity, and positioning rather than random motion. Once you understand what each part represents, charts become more structured and easier to interpret.
Why Candlestick Anatomy Matters in Trading
The candlesticks show visually the changes in price that occurred during a certain time period.
By analyzing the opening, highest, lowest, and closing prices, it becomes possible for traders to see the price range during that time and to know whether the period finished with higher or lower price compared to the start of the period.
Such information may be useful in studying volatility and price behavior. But a single candlestick alone does not determine what the next move of the market will be.
Analysis of candlesticks without taking into account market conditions may result in incomplete conclusions. Comprehension of information contained in a candlestick and its limitations constitutes an important part of learning technical analysis.
This can lead to emotional trading decisions, excessive buying and selling, and weak risk management, as discussed in Why Traders Fail?
Candlestick structure provides clarity. Traders should focus on observing behavior rather than reacting emotionally.
What Is a Candlestick Made Of
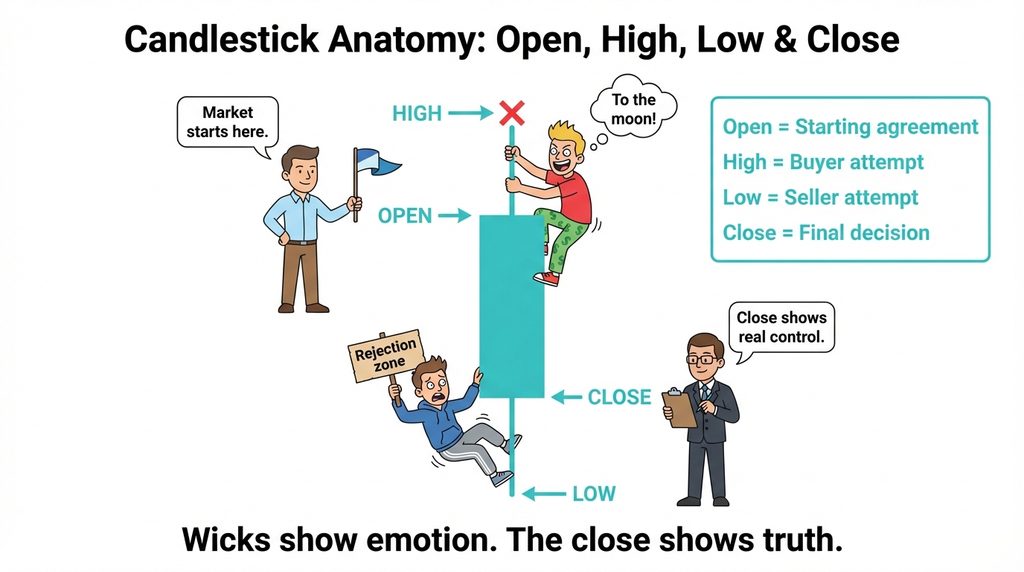
Each candlestick represents four main price values over a specified timeframe.
These are known as open, high, low and close, commonly abbreviated as OHLC.
- Open: The first recorded price within the period.
- High: The highest recorded price within the period.
- Low: The lowest recorded price within the period.
- Close: The final recorded price within the period.
Prices vary depending on the type of instrument, the provider of data, and the way of building the chart.
For instance, there are charts where for Forex and CFD prices of bid are used instead of prices of real transactions.
Open-high-low-close numbers are a summary of prices for the selected period of time but not all changes in prices or their order. Candlestick charts are applied to various types of instruments like Forex, stocks, commodities, and indices.
These four points outline the complete spectrum of price fluctuations over that period. This structure appears in every kind of investment, whether you're dealing with currencies, stock market indices, or raw materials, as in Asset Classes Explained. These prices provide a complete view of market activity during that period.
The Open Price Explained
The opening price is the first recorded price in the defined time frame of the candlestick. This serves as the basis for comparing the price changes in the time period.
When the closing price is higher than the opening price, the candlestick shows a net rise in prices. When the closing price is lower than the opening price, the candlestick shows a net fall in prices.
But the connection between the opening and closing prices does not reveal the intention of the buyer or seller. Understanding the relationship between open and close is essential before making trading decisions, especially when learning execution concepts outlined in Trade Mechanics & Execution Basics.
The Close Price Explained
The closing price refers to the last recorded price within a certain time frame of a candlestick. This is usually preferred for technical analysis due to the consistency in comparison to completed time periods.
For instance, the closing prices can be compared one after another to observe past trends of the prices.
But the closing price may not reflect any market agreement at a particular level. The importance of a closing price can be evaluated based on the time frame and instrument itself.
The significance of setting clear entry and exit points based on how prices move is further discussed in Take Profit & Stop Loss Explained. Closes reflect conviction, not just movement.
The High and Low Explained
High
The high price shows the maximum recorded price in the candlestick's time frame.
Low
The low price shows the minimum recorded price within the same time period.
Combining these two figures, the price range can be calculated.
For example, when the high of a candle is 1.1050 and the low is 1.1000, the range will be 0.0050, which means that the price range is 50 pips for the typical four decimal place Forex quotation.
A wide range of prices might show considerable price movement within the time period.
However, the high and low do not independently explain why the price moved or establish whether a particular level was rejected by market participants. Market liquidity, volatility and execution conditions may influence price behaviour.
These reactions are closely tied to liquidity and execution conditions, as explained in What Is Liquidity?, where price moves more smoothly in liquid conditions and more erratically when liquidity is thin.
Highs and lows show exploration. The close shows we're on the same page
Candlestick Body vs Wicks
The body represents the difference between the opening and closing prices. A larger body indicates a greater net price change between the open and close. A smaller body indicates that the opening and closing prices were relatively close together.
Upper and Lower Wicks
The upper wick extends from the higher of the opening and closing prices to the period's high.
The lower wick extends from the lower of the opening and closing prices to the period's low.
Wicks show that prices reached levels beyond the candle body during the period.
Long wicks are sometimes interpreted as possible signs of buying or selling pressure, but they do not prove that prices were rejected or predict subsequent movements.
These moves mirror the real-world trading scene, including how spreads, liquidity, and order flow play out, as detailed in Bid-Ask Spread Explained. The candle's shape essentially depicts the struggle between buyers and sellers.
Bullish vs Bearish Candlestick Anatomy
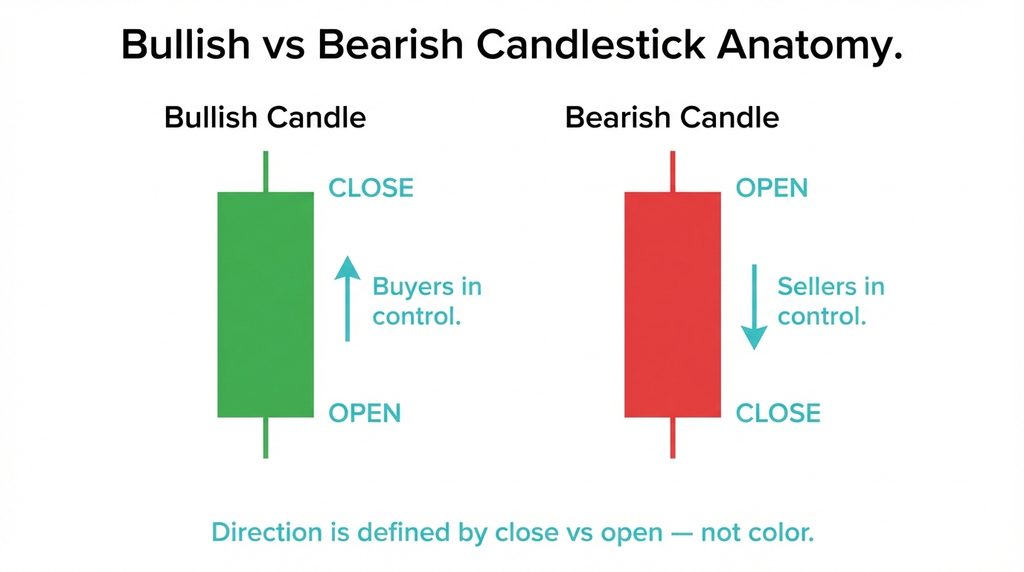
In the case of a bullish candlestick, the closing price is above the opening price. In the case of a bearish candlestick, the closing price is below the opening price.
Such terms refer to the direction in which the net price has changed in the specified time period. Bullish candles are usually painted in green color, whereas bearish candles are painted in red color.
But you can change the colors in the chart, that's why the connection between the opening and closing prices becomes more important than the colors itself.
If the opening and closing prices are equal or very similar, the candlestick will have a small body or will resemble doji.
This supports the broader concept in Trade Lifecycle Explained: from Idea to Exit, which says we must make choices based on how things are set up and the steps we take, not just what we see.
Price relationships matter more than visuals.
How Candlestick Anatomy Changes With Timeframe
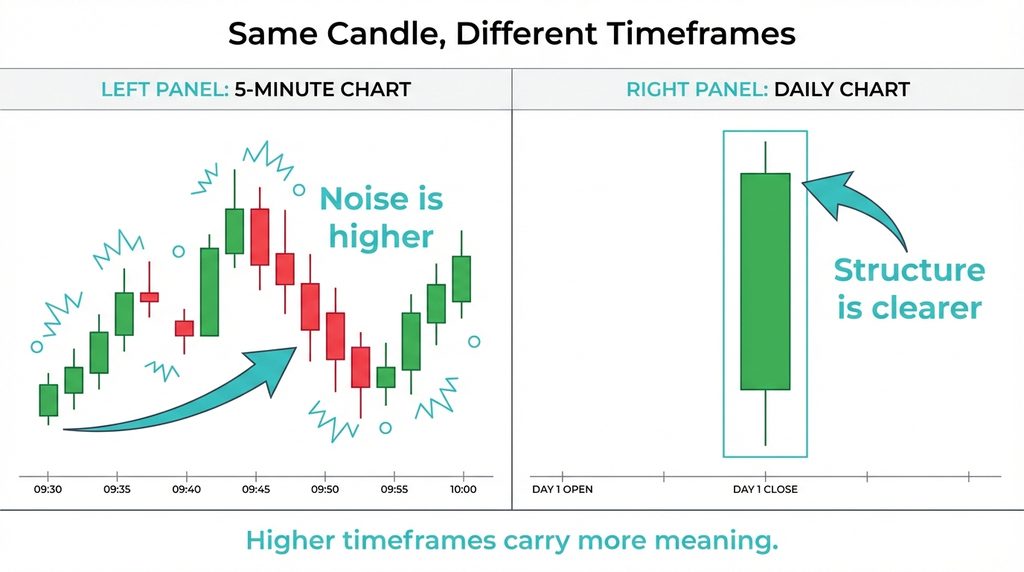
Candlestick structure is consistent irrespective of which time frame the chart is using.
One minute candlestick represents price action for a period of one minute, whereas daily candlestick represents price action for the entire trading session. The longer the time frame, the longer the period of price movement is represented, but that doesn’t mean that there is more institutional involvement. Different time frames might provide different perspectives on the same market as well.
For instance, a daily candlestick might illustrate a slight price movement despite large variations within the session.
Understanding the time frame makes the interpretation of candlesticks easier. Higher timeframes provide clearer insight into institutional activity, as discussed in Who Really Moves the Stock Markets? Understanding the timeframe context prevents overreacting to insignificant movements.
Common Beginner Mistakes With Candlesticks
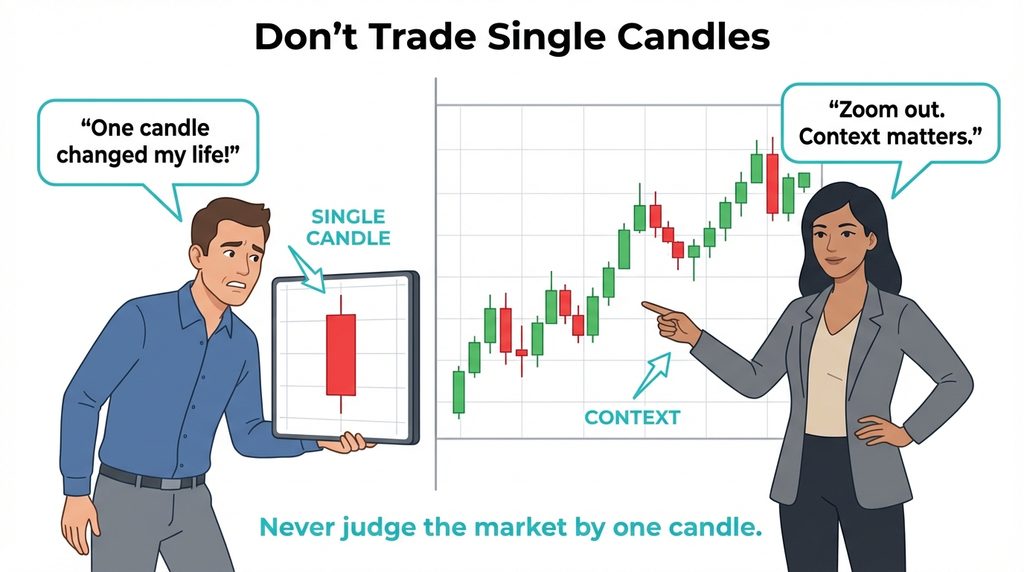
It is one such misconception to believe that only one candlestick is enough to accurately forecast the next move in the market.
It is another misconception to use long candle wicks as clear signs of price rejection without taking other factors into account. New investors often forget about the importance of selecting the proper time frame, volatility, bid/ask spread and the limitations of the price information in the chart.
For instance, a candlestick calculated using the bids does not give an accurate picture of the price at which it is possible to open the trade in either direction.
This will help traders differentiate between price history and price predictions. It's key to manage risk and chart analysis together, as the book Common Risk Management Mistakes Beginners Make points out.
Candles provide information, but context provides meaning.
How Beginners Should Practice Candlestick Reading
The beginning trader might begin by studying existing candlesticks and seeing their opening, high, low, and close prices. Seeing candlesticks on different timeframes would be a way to show how the same actions are seen depending on the timeframe.
An artificial trading environment is an additional way of looking at chart elements without the need to trade for real money. However, such an environment does not completely simulate live trading and its psychological impact on the trader.
Check out the VARIANSE trading account page for more info.
VARIANSE Academy provides structured learning that connects candlestick analysis with risk management and execution. Observation builds clarity. Clarity builds discipline.
Conclusion: Candlestick Anatomy Explained
The structure of candlestick charts offers a means to visualize historical price action. A candlestick comprises four main price points: open, high, low and close.
The body of the candle shows the range between the opening and closing prices, whereas the wicks represent the highest and lowest prices that fall outside of the body.
This will help the beginner reader understand price charts and the limitations of the candlestick on its own.
Nevertheless, candlesticks cannot provide any information about the intentions of market players or price direction in the future.
It is important to have knowledge of candlestick construction, but it should be used together with an understanding of market conditions, costs and risks.