
AI Chart Analysis is often a misunderstood topic in today’s trading scene. Many traders believe artificial intelligence can “read charts,” predict price direction, or fully replace automated technical analysis. That assumption isn't just wrong; it’s risky.
Used correctly, AI Chart Analysis can improve clarity, reduce bias, and speed up structured thinking. Used incorrectly, it leads to misplaced trust, overthinking, and poor action.
AI is not a shortcut to profitability. This analytical buddy kicks into gear only with discipline, risk control, and a structured approach, like the ones in Process-Oriented Trading.
What Is AI Chart Analysis in Trading?
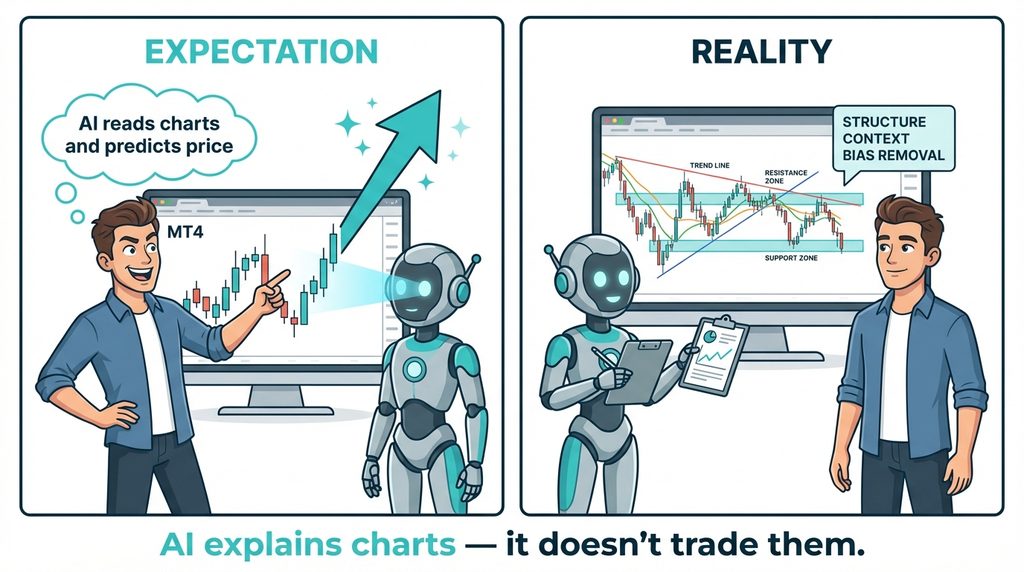
AI Chart Analysis uses AI trading tools to interpret static price charts, identify structure, and describe observable market conditions.
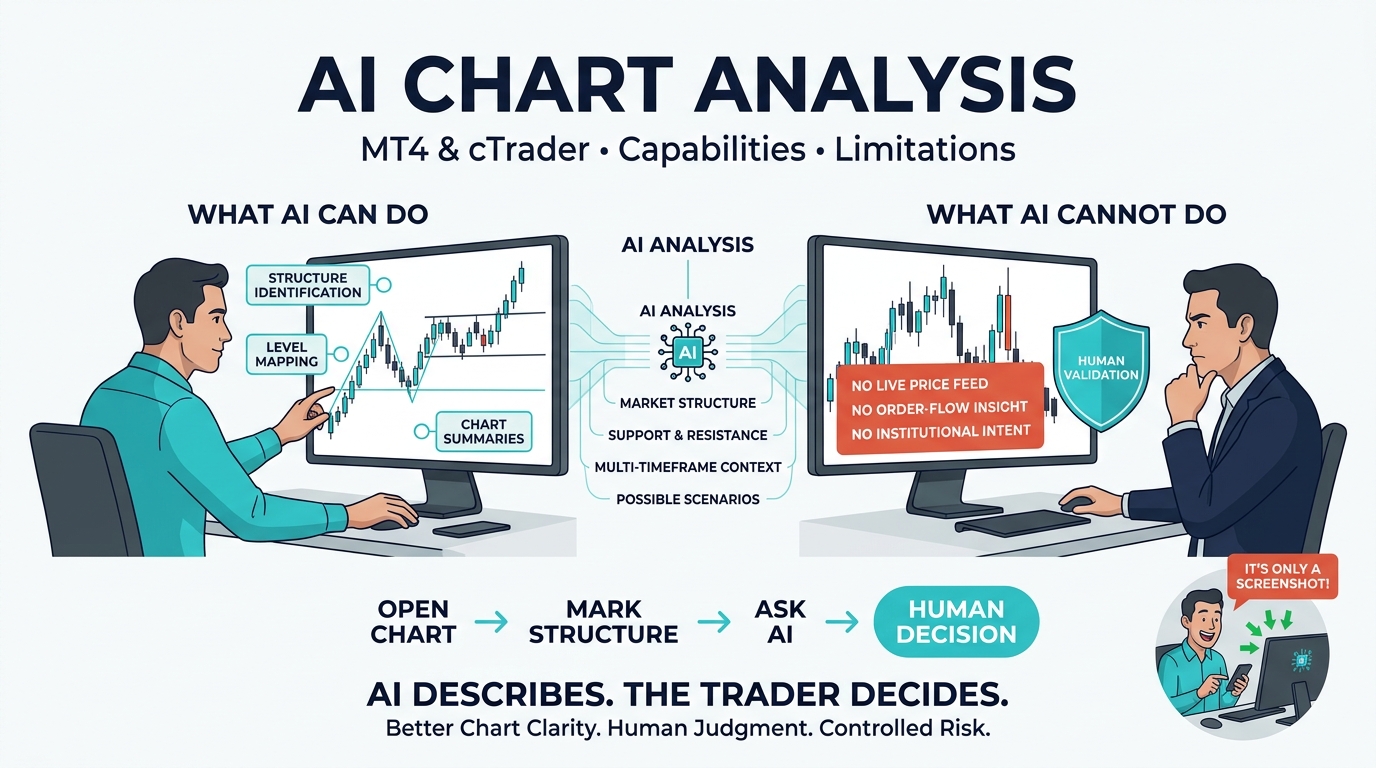
AI does not see live prices, liquidity, broker flow, or institutional intent. It looks at screenshots or just text.
This limitation means AI Chart Analysis describes visuals it does not understand probability or context. Traders who overlook this tend to repeat the same mistakes discussed in Overconfidence in Trading.
What AI Actually Does Well
AI Chart Analysis can improve analytical structure and remove emotional distortion from chart reading. Common strengths are
- Describing market structure
- Labeling support & resistance
- Highlighting basic patterns and chart pattern recognition
- Summarising multi-timeframe context
- Reinforcing objectivity over emotion
These strengths relate to clarity and speed, not to prediction or execution — which is why AI Chart Analysis must sit within a risk-controlled framework, similar to Reducing Risk Trading Strategy.
How AI Chart Analysis Works with MT4 & cTrader
AI Chart Analysis does not directly plug into MT4 or cTrader. Instead, traders use a manual-assisted workflow in which AI serves as a second opinion rather than a signal engine for MT4 or cTrader analysis.
Practical AI Chart Analysis Workflow. Open A Chart In MT4 or cTrader
- Mark structure and levels manually
- Screenshot the chart
- Upload to AI
- Ask structured questions, not predictions
Chart Example: Market Structure Identification
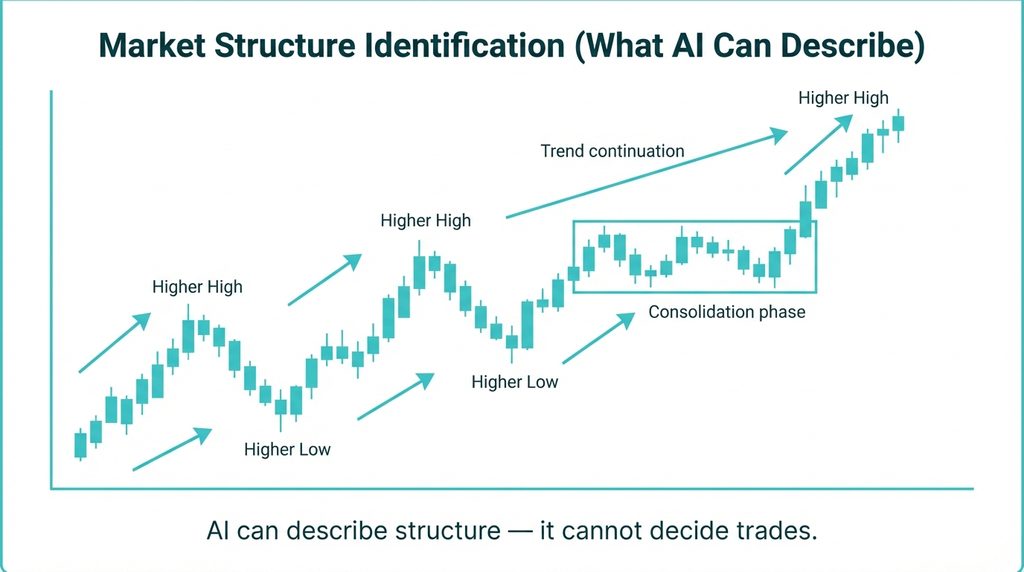
What AI Chart Analysis can help with
- Identifying HH / HL or LH / LL
- Confirming trend direction
- Describing consolidation vs expansion
What AI Chart Analysis cannot do
- Confirm institutional intent
- Detect liquidity grabs
- Time entries or exits
Keeping the decision-making process human helps avoid outsourcing emotions, a key factor in trader burnout and overtrading, as the linked article discusses.
AI Chart Analysis vs Traditional Technical Analysis
AI Chart Analysis offers speed and consistency. Humans bring their own perspective and understanding.
AI Chart Analysis can process visuals quickly, but it cannot understand macro events, psychological pressure, or liquidity intent. Execution choices are always made by people, which is why having a solid mental framework like Trading Resilience is more crucial than any gadget.
Why AI Chart Analysis Fails (This Matters for Survival)
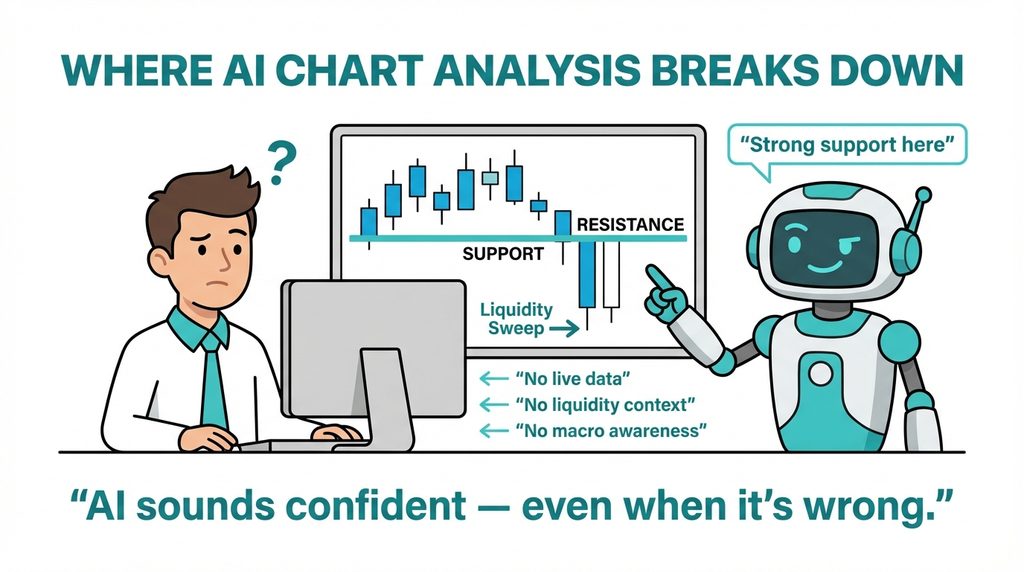
AI Chart Analysis often sounds confident even when incomplete. That fake bravado really hurts traders the most.
Core Limitations of AI Chart Analysis
- No live price feed
- No liquidity or order-book insight
- No macro awareness
- Susceptible to confirmation bias
- Over-defining exact levels
Human verification is a must. Blind faith can end up in the same kind of disappointment that’s talked about in Trading Losing Streaks Explained.
AI Chart Analysis can help Forex and CFD traders interpret technical patterns, but identifying chart structures does not eliminate market uncertainty. The U.S. Securities and Exchange Commission's investor guidance on investment risk explains the importance of understanding the risks associated with investment decisions. Traders should therefore independently verify AI-generated chart interpretations, consider broader market conditions and apply predefined risk management rules rather than relying solely on automated technical analysis.
What AI Chart Analysis Is Actually Best Used For
AI Chart Analysis is most effective when it enhances reflection and structure, not decision authority.
High-Value Use Cases
- Pre-trade context checks
- Multi-timeframe summaries
- Bias validation
- Journaling & post-trade reviews
- Educational reinforcement
These practices help keep things consistent and totally in line with the principles of Professional Trading psychology
Low-Value / Dangerous Use Cases
- Entry signals
- Exit timing
- Risk sizing
- “Buy or sell?” questions
If AI trading handles your trades, you’re dodging the risk game; you’re off the hook.
Safe AI-Assisted AI Chart Analysis Framework
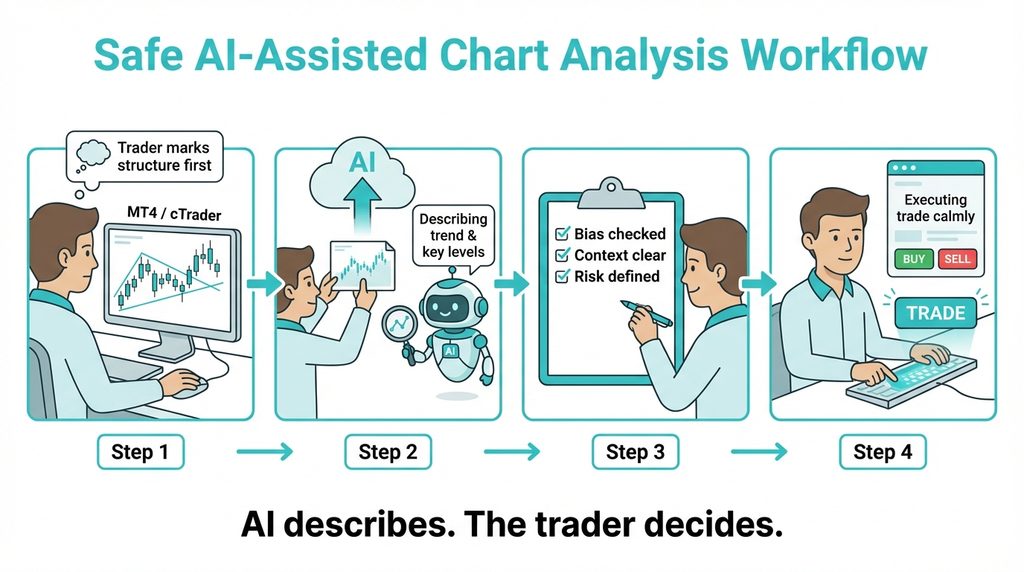
Rule: AI Chart Analysis describes. The trader decides. This keeps AI inside its competence boundary and protects behavioral stability, similar to the exit discipline discussed in Trading Exit Strategies.
Common Mistakes Traders Make with AI Chart Analysis
- Treating AI Chart Analysis output as a signal
- Using AI Chart Analysis only to confirm bias
- Ignoring risk management
- Believing AI Chart Analysis understands probability
- Over-analyzing every chart
AI Chart Analysis should reduce noise, not multiply it.
Conclusion: AI Is a Tool, Not a Trading Edge
AI Chart Analysis improves clarity only when used within strict behavioral and risk limits. It doesn’t give you an advantage, substitute talent, or remove doubt.
Long-term traders use AI trading tools to support structured thinking, journaling, and disciplined execution, never to escape responsibility. Tools can really boost performance, but they don’t fix fundamental skill gaps.